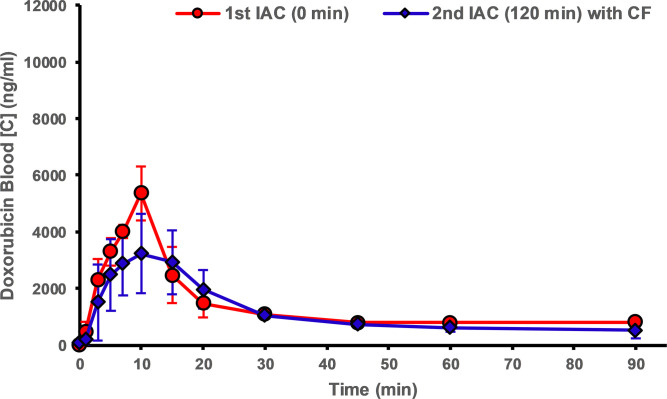
Figure 4b:
Blood concentration–time profiles of doxorubicin during in vivo experiments. ChemoFilter (CF) devices decrease peak doxorubicin (DOX) concentration and reduce the area under the curve for drug exposure. The graphs compare profiles of DOX during the first (blue) and second (red) intra-arterial chemotherapy (IAC) infusions for (a) group 1 (IAC vs IAC, n = 3) and (b) group 2 (IAC vs IAC and CF, n = 3). Data are mean ± standard deviation.

