
Since January 2020 Elsevier has created a COVID-19 resource centre with free information in English and Mandarin on the novel coronavirus COVID-19. The COVID-19 resource centre is hosted on Elsevier Connect, the company's public news and information website. Elsevier hereby grants permission to make all its COVID-19-related research that is available on the COVID-19 resource centre - including this research content - immediately available in PubMed Central and other publicly funded repositories, such as the WHO COVID database with rights for unrestricted research re-use and analyses in any form or by any means with acknowledgement of the original source. These permissions are granted for free by Elsevier for as long as the COVID-19 resource centre remains active.
Fig. 4.
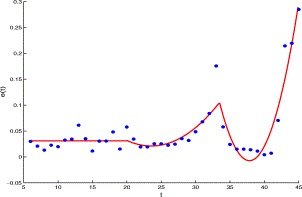
The per capita clear rate of the suspect versus time t, the solid line is made from e(t) and the dots represent the data from Table 1.