Figure 1.
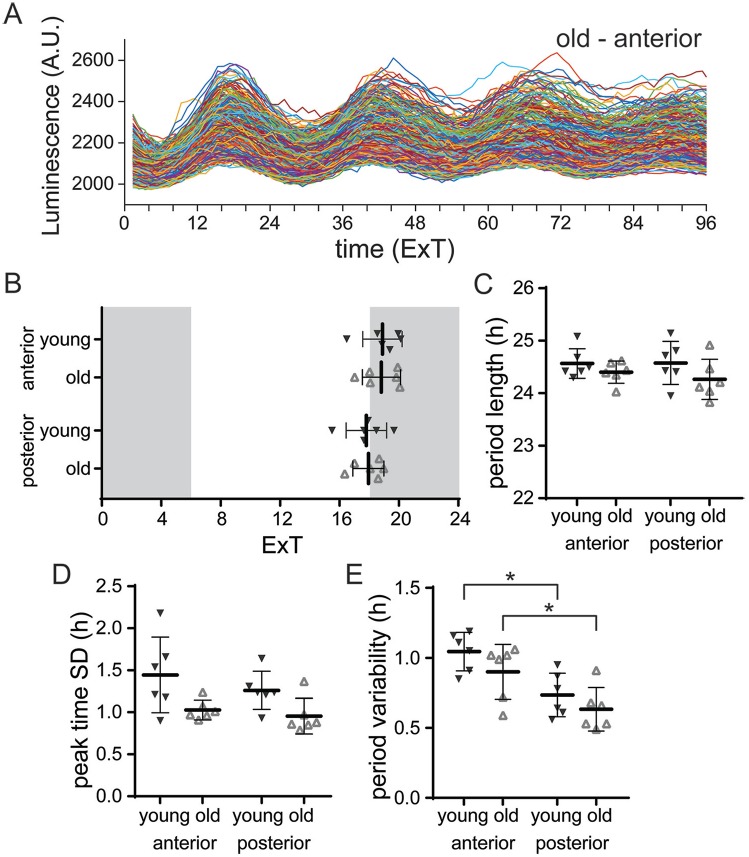
PER2::LUC expression is not altered with aging under LD 12:12. (A) Examples of raw traces of bioluminescence intensity representing PER2::LUC expression from single cells in the anterior SCN of an old mouse (anterior, n = 242 cells; other examples in Suppl. Fig. S3). (B) Average peak time of PER2::LUC rhythms per slice of the anterior and posterior SCN from young and old mice, plotted as external time (ExT). Shaded areas represent the projected dark phase. (C) The average period length of the first 3 cycles in vitro is shown for the anterior and posterior SCN from young and old mice. (D) Phase distribution is defined as the standard deviation (SD) of peak time of the first cycle in vitro and was calculated per slice. Phase distribution is shown for the anterior and posterior SCN from young and old mice. (E) Period variability of single cells, averaged per slice from the anterior and posterior SCN from young and old mice. Filled triangles represent young mice (n = 6), and open triangles represent old mice (n = 6). Bars indicate mean ± SD. *p < 0.05, 2-way analysis of variance, corrected for multiple comparison with Tukey’s test.

