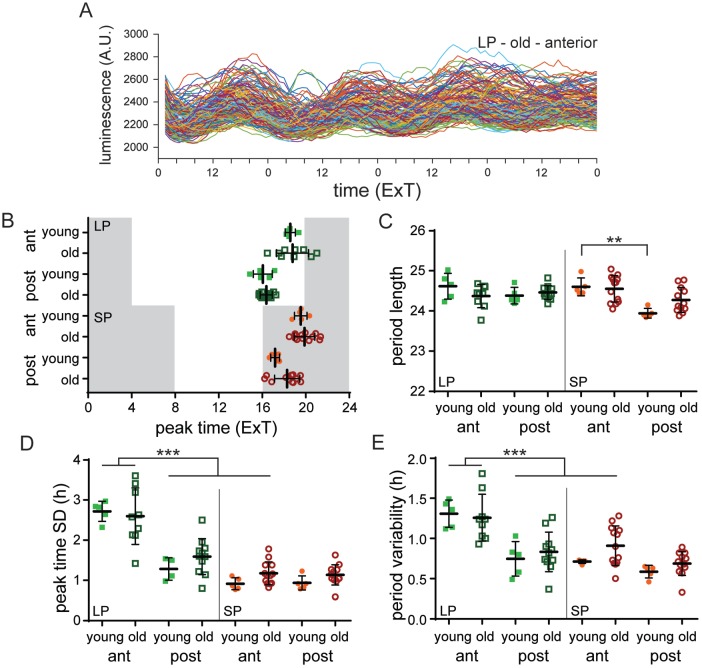
Figure 3.
The molecular clock in the SCN of old mice can still adapt to different photoperiods. (A) Examples of raw traces of bioluminescence intensity representing PER2::LUC expression from single cells from the anterior SCN of an old mouse (n = 130 cells). (B) Average peak time of PER2::LUC rhythms per slice of the anterior and posterior SCN from young and old mice, adapted to long photoperiod (LP) and short photoperiod (SP) plotted as external time (ExT). Shaded areas represent the projected dark phase. (C) Average period length of the first 3 cycles in vitro is shown for the anterior and posterior SCN from young and old mice entrained to LP and SP. (D) Phase distribution of peak times per slice in the anterior and posterior SCN of young and old mice adapted to LP and SP. (E) Single-cell period variability per slice in the anterior and posterior SCN of young and old mice adapted to LP and SP. LP: anterior: young: n = 5, old: n = 9, posterior: young: n = 5, old: n = 11; SP: anterior: young: n = 5, old: n = 13, posterior: young: n = 5, old: n = 12. Filled circles represent SP, young; open circles represent SP, old; filled squares represent LP, young; open squares represent LP, old. Bars indicate mean ± SD. **p < 0.01, ***p < 0.001, 1-way analysis of variance, corrected for multiple comparison with Sidak’s test.

