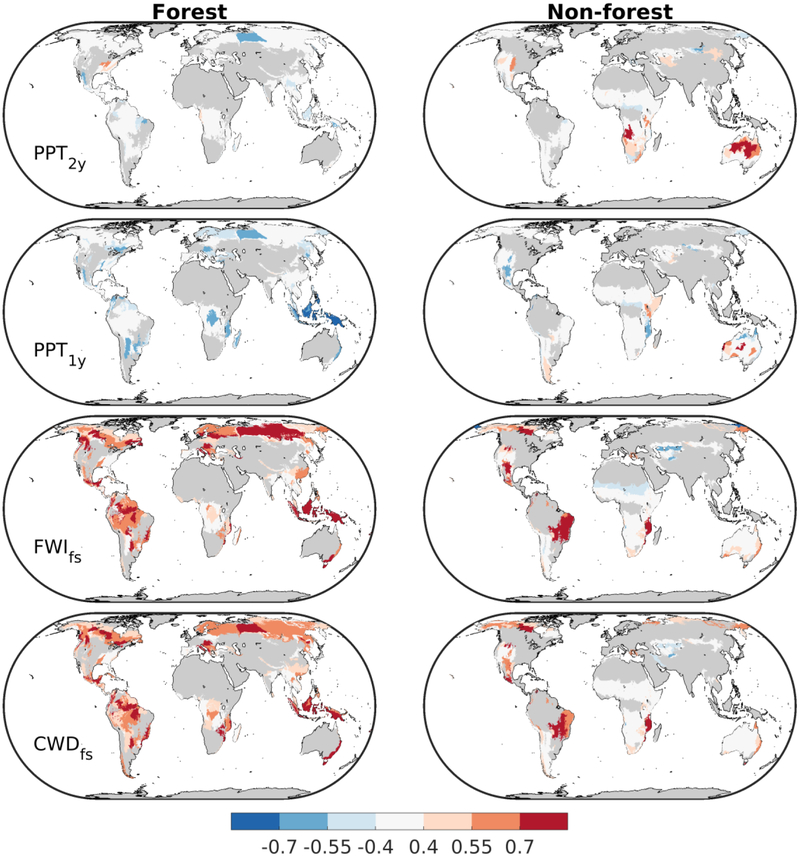
Figure 2:
Linear Pearson’s correlation between the base-10 logarithm of fire year burned area and 12-month accumulated precipitation ending 14-months prior to the fire season (PPT2y), 12-month accumulated precipitation ending 2-months prior to the fire season (PPT1y), and the Fire Weather Index (FWIfs), and climatic water deficit (CWDfs) over the fire season. Only statistically significant correlations (∣r∣>0.4) are colored. Ecoregions with less than 20% land cover for each vegetation class are shaded darker gray.

