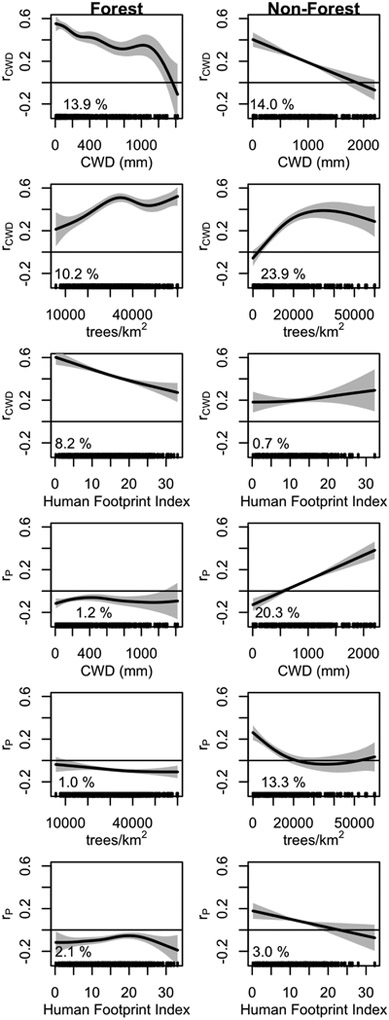
Figure 3:
Model generalized additive model (GAM) fit of climate correlations to burned area across global ecoregions for (left) forests and (right) non-forests as functions of spatial gradients in (top to bottom) annual average climatic water deficit (CWD), average tree density, and the Human Footprint Index. The top three panels show GAMs for correlations with concurrent CWD (rCWD), while the bottom three panels show GAMs for correlations with antecedent precipitation (14–25 months prior to the fire season, rP). The grey shading shows the 95% CI, black stripes along the x-axis denote the distribution of data from ecoregions, and values reported above x-axes show the percent of geographic variance explained by each GAM.

