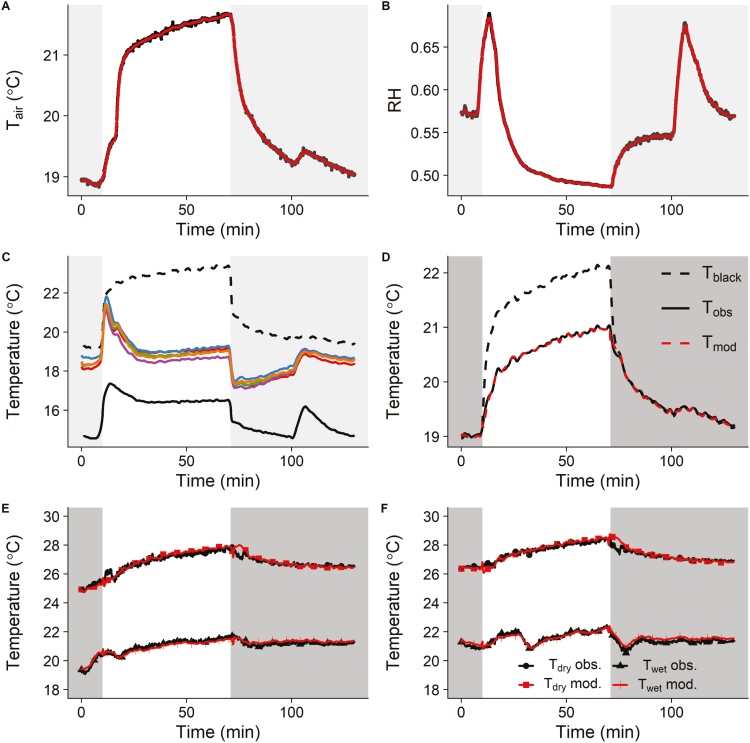
Fig. 1.
Environmental conditions and leaf temperature kinetics observed in wheat (Paragon) after a step increase in light intensity from dark to light (0 to 440 µmol m−2 s−1, 1 h) and a step decrease from light to dark (1 h). (A) Relative humidity (RH). (B) Air temperature (Tair). (C) Temporal kinetic of leaf temperature (leaves in different colours) and corresponding predictions for a non-transpiring (black dashed line) and an unlimited conductance leaf (black continuous line). (D) Modelled (Tmod) and observed (Tobs) temperature of white reference material using black reference material temperature (Tblack) used to validate boundary layer estimates. (E) Observed (black) and modelled (red) dry (Tdry) and wet (Twet) filter paper reference temperature kinetics used to calibrate the energy balance model. (F) Observed (black) and modelled (red) dry (Tdry) and wet (Twet) filter paper reference temperature kinetics used to validate the energy balance model. Grey areas represent dark conditions.

