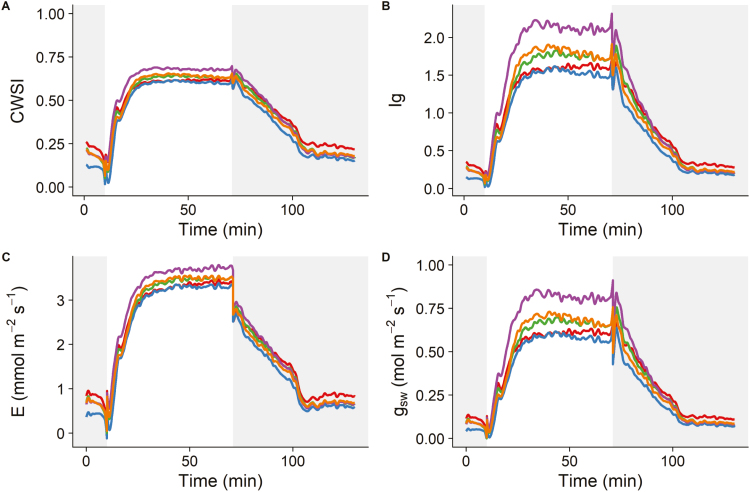
Fig. 2.
Estimated (A) crop water stress index (CWSI), (B) conductance index (Ig), (C) transpiration rate (E), and (D) stomatal conductance to water vapour (gsw) in wheat (Paragon) after a step increase in light intensity from dark to light (0 to 440 µmol m−2 s−1, 1 h) and a step decrease from light to dark (1 h). Grey areas represent dark conditions.

