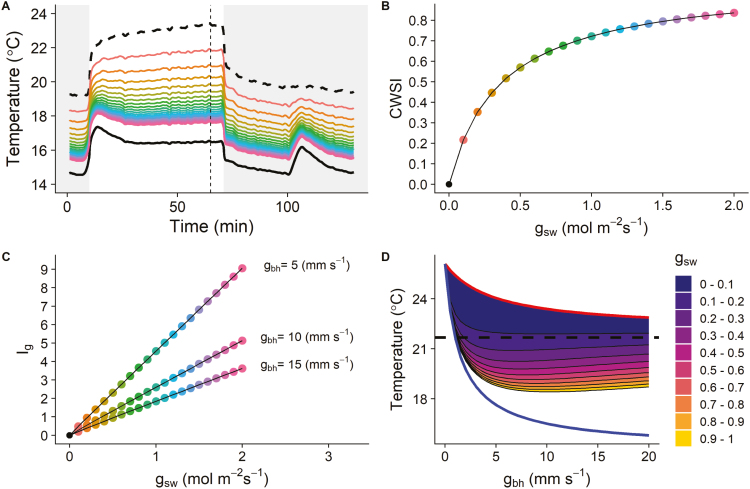
Fig. 3.
(A) Modelled temporal kinetics of leaf temperature for stomatal conductance to water vapour (gsw) ranging from 0.1 mol m−2 s−1 to 2 mol m−2 s−1 (step: 0.1 mol m−2 s−1, coloured lines) and predictions for a non-transpiring (black dashed line) and an unlimited stomatal conductance leaf (black continuous line). (B) Crop water stress index as a function of gsw. (C) Conductance index (Ig) as a function of gsw for different one-side boundary layer conductance (gbw). The coloured lines (A) and dots (B, C) correspond, respectively, to the same gsw values. (D) Relationship between leaf temperatures simulated for different gsw and gbw illustrating the changes in scale between the dry (red line) and wet (blue line) references when gbw varies. The black dashed line represents the air temperature. The vertical dashed line in (A) indicates the time (65 min) at which the relationships in (B), (C), and (D) were estimated.

