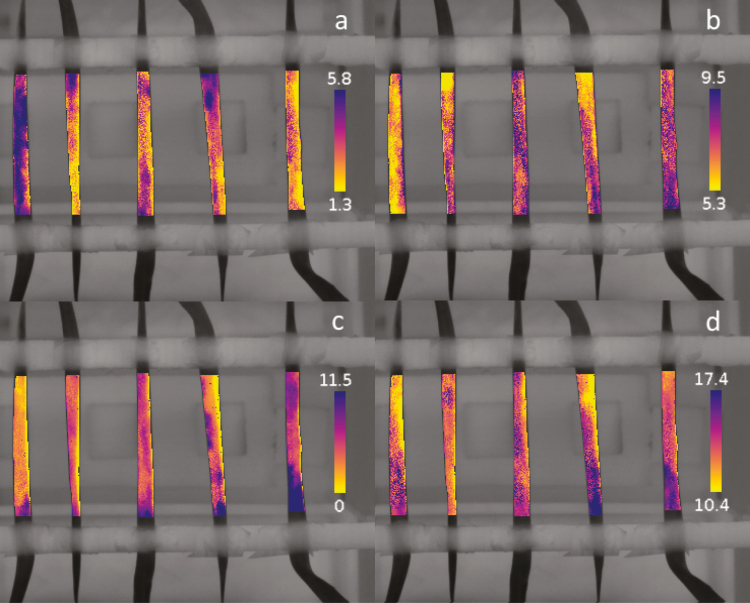
Fig. 4.
Spatial representation of the speed of stomatal response for a step increase (a, b) and decrease (c, d) in light intensity. The speed of stomatal response is described by a lag time (λ; a, c) and a time constant (k; b, d) derived from Equation 11. The colour scales represent an interval that contains 95% of all the values (min). Each pixel represents an area of ~0.6 mm2 (1 pixel per 0.77 mm).

