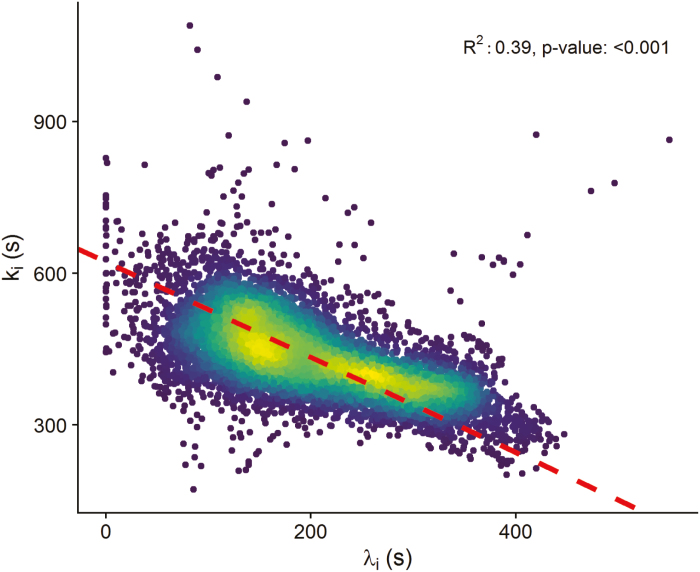
Fig. 5.
Relationship between the time lag (λ i, s) and time constant (ki, s) estimated using Equation 11 and describing the speed of stomatal responses for a step increase in light intensity of five wheat leaves. The red dashed line represents a standard major axis regression line. The colour gradient represents the density of points, with yellow being the highest density.

