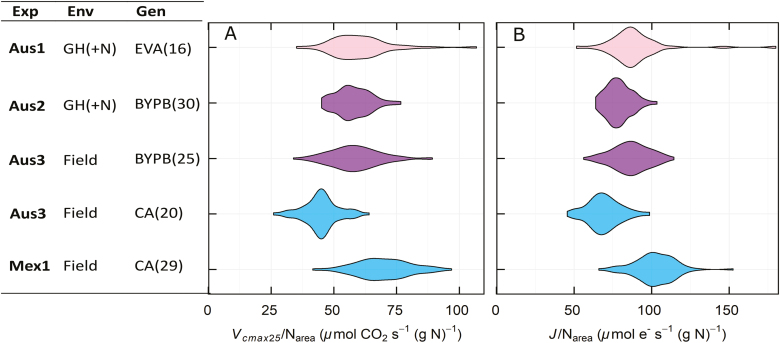
Fig. 5.
Violin plot representing the distribution of photosynthetic efficiency as (A) Vcmax25/Narea and (B) J/Narea of the genotypes by experiment, excluding low nitrogen treatments. Experiments were measured in Australia (Aus1, Aus2, and Aus3) and in Mexico (Mex1). Experiments were set up in different environments: glasshouse (GH) under normal nitrogen conditions (+N) or the field. Three different set of genotypes were assessed: Early Vigour set, EV; BUNYIP set, BYP; and CIMCOG set, C.

