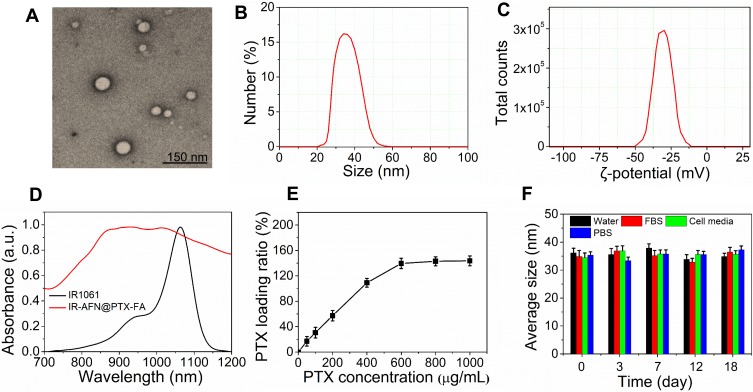
Figure 2.
(A) The TEM image of IR-AFN@PTX-FA. (B) The size distribution and (C) zeta potential distribution of IR-AFN@PTX-FA. (D) The absorption spectra of IR1061 and IR-AFN@PTX-FA. (E) The PTX loading ratio of IR-AFN@PTX-FA. (F) The hydrodynamic particle size change of IR-AFN@PTX-FA in water, FBS, cell media PBS over 18 days.Abbreviations: TEM, transmission electron microscopy; IR, IR1061; AFN, apoferritin; PTX, paclitaxel; FA, folic acid; FBS, fetal bovine serum; PBS, phosphate buffer solution.

