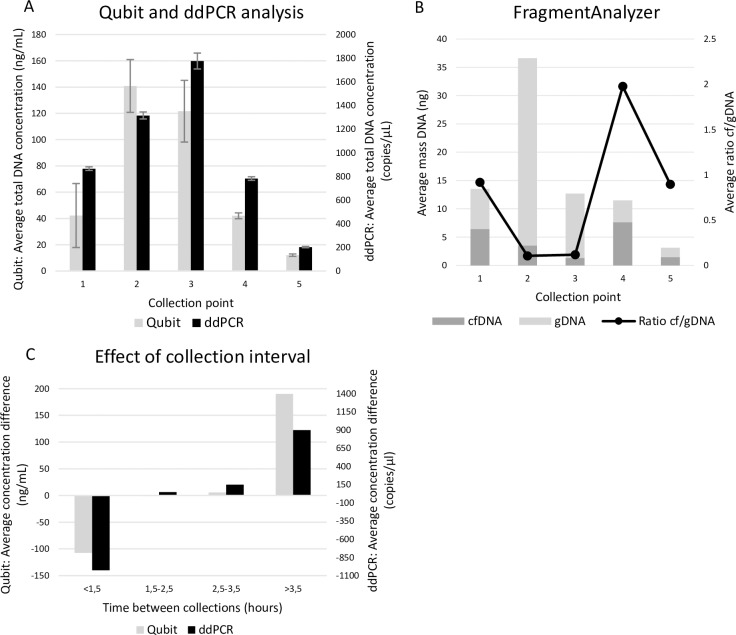
Fig 4. Collection time points.
Different collection points were investigated throughout one entire day starting with the first morning urine with a maximum of five consecutive samples being collected. Results from four HVs are shown as an average for each collection point. A: Total DNA concentrations analyzed with Qubit fluorometer and ddPCR. B: Amount of cfDNA and gDNA as determined with the FragmentAnalyzer. C: The effect on time interval between two consecutive collection points on the total concentration measured with Qubit and ddPCR. cfDNA = circulating cell-free DNA, ddPCR = digital droplet PCR, gDNA = genomic DNA, HV = healthy volunteer.

