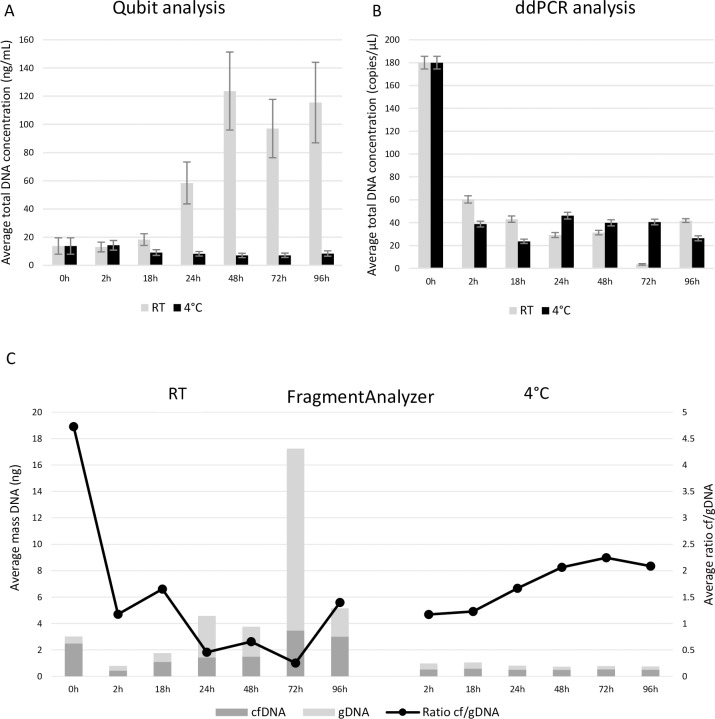
Fig 6. Effect of storage temperature and time in fresh urine samples.
The reference fractions (0h) were processed immediately after collection. The other fractions were stored at RT or 4°C with a varying storage time. Results from all included samples are shown as an average for each fraction A: Total DNA concentrations analyzed with Qubit fluorometer. B: Total DNA concentrations analyzed with ddPCR. C: Amount of cfDNA and gDNA as determined with the FragmentAnalyzer. cfDNA = circulating cell-free DNA, ddPCR = digital droplet PCR, gDNA = genomic DNA, RT = room temperature.

