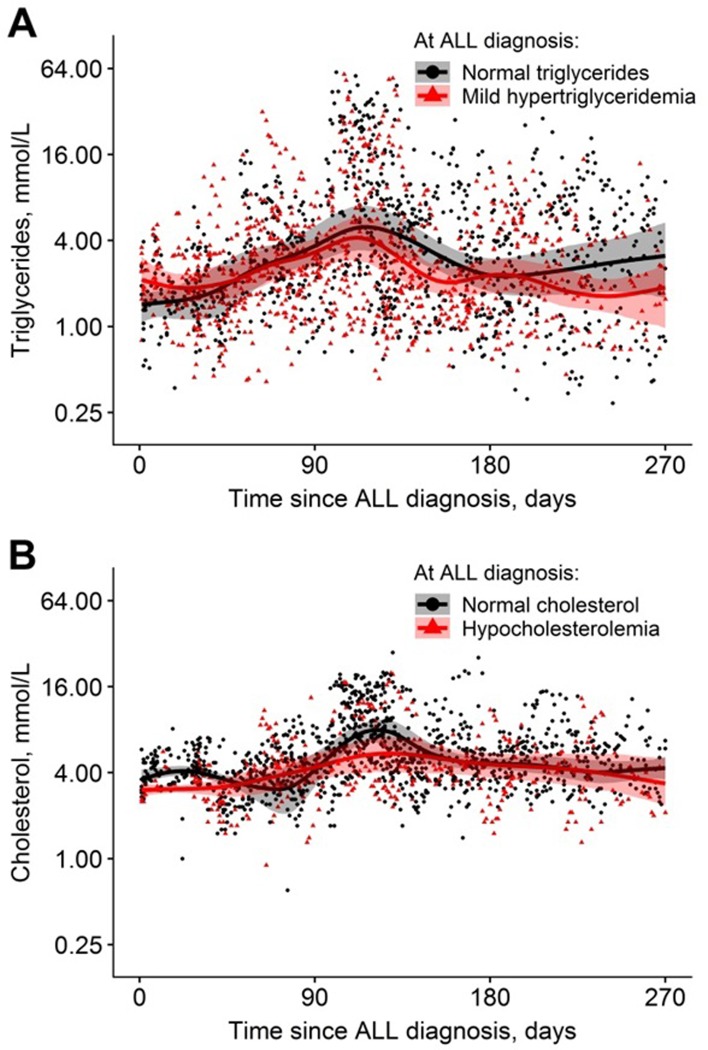
Fig 3.
On-therapy levels of A) triglycerides with mean curves according to normal and mild hypertriglyceridemia at time of ALL-diagnosis, and B) total cholesterol according to normal and hypocholesterolemia at time of ALL-diagnosis. The shaded areas show the approximate 95% percentile bootstrap pointwise confidence intervals for the estimated mean curves.

