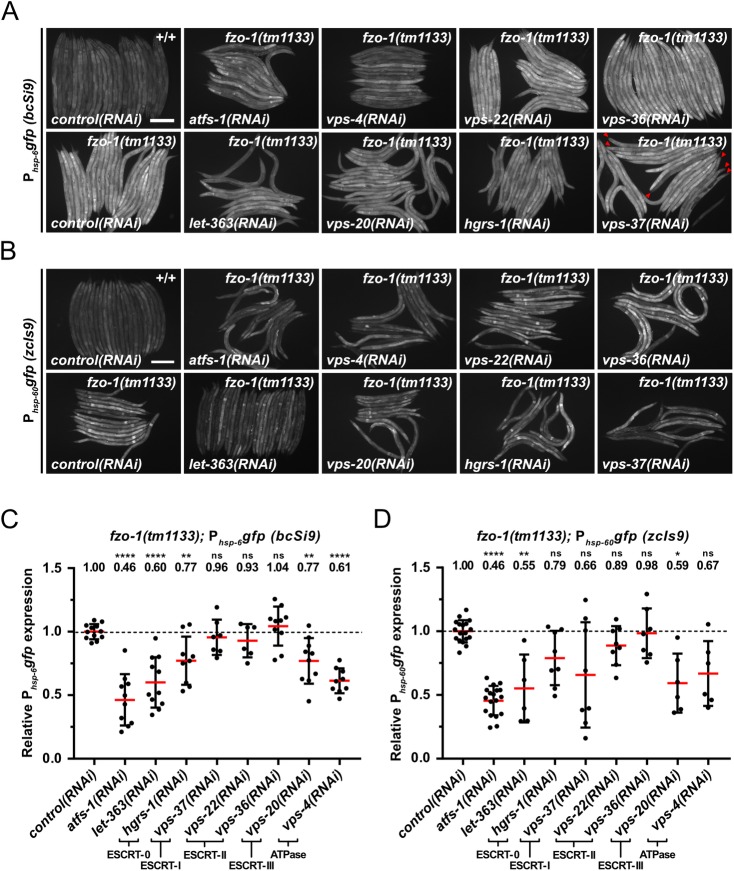
Fig 1. Depletion of ESCRT components and LET-363 suppresses fzo-1(tm1133)-induced UPRmt.
(A) Fluorescence images of L4 larvae expressing Phsp-6gfp (bcSi9) in wild type (+/+) or fzo-1(tm1133). L4 larvae were subjected to control(RNAi), atfs-1(RNAi), vps-4(RNAi), vps-20(RNAi), vps-22(RNAi), hgrs-1(RNAi), vps-36(RNAi), vps-37(RNAi) or let-363(RNAi) and the F1 generation was imaged. Red arrowheads indicate suppressed animals upon vps-37(RNAi). Scale bar: 200 μm. (B) Fluorescence images of L4 larvae expressing Phsp-60gfp (zcIs9) in wild type (+/+) or fzo-1(tm1133). L4 larvae were subjected to control(RNAi), atfs-1(RNAi), vps-4(RNAi), vps-20(RNAi), vps-22(RNAi), hgrs-1(RNAi), vps-36(RNAi), vps-37(RNAi) or let-363(RNAi) and the F1 generation was imaged. Scale bar: 200 μm. (C) Quantifications of fluorescence images from panel A. After subtracting the mean fluorescence intensity of wild type (+/+) on control(RNAi), the values were normalized to fzo-1(tm1133) on control(RNAi). Each dot represents the quantification of fluorescence intensity of 15–20 L4 larvae. Values indicate means ± SD of at least 3 independent experiments in duplicates. **P<0.01, ****P<0.0001 using one-way ANOVA with Dunnett’s multiple comparison test to control(RNAi). (D) Quantifications of fluorescence images from panel B. After subtracting the mean fluorescence intensity of wild type (+/+) on control(RNAi), the values were normalized to fzo-1(tm1133) on control(RNAi). Each dot represents the quantification of fluorescence intensity of 10–20 L4 larvae. Values indicate means ± SD of 3 independent experiments in duplicates. ns: not significant, *P<0.05, **P<0.01, ****P<0.0001 using Kruskal-Wallis test with Dunn’s multiple comparison test to control(RNAi).

