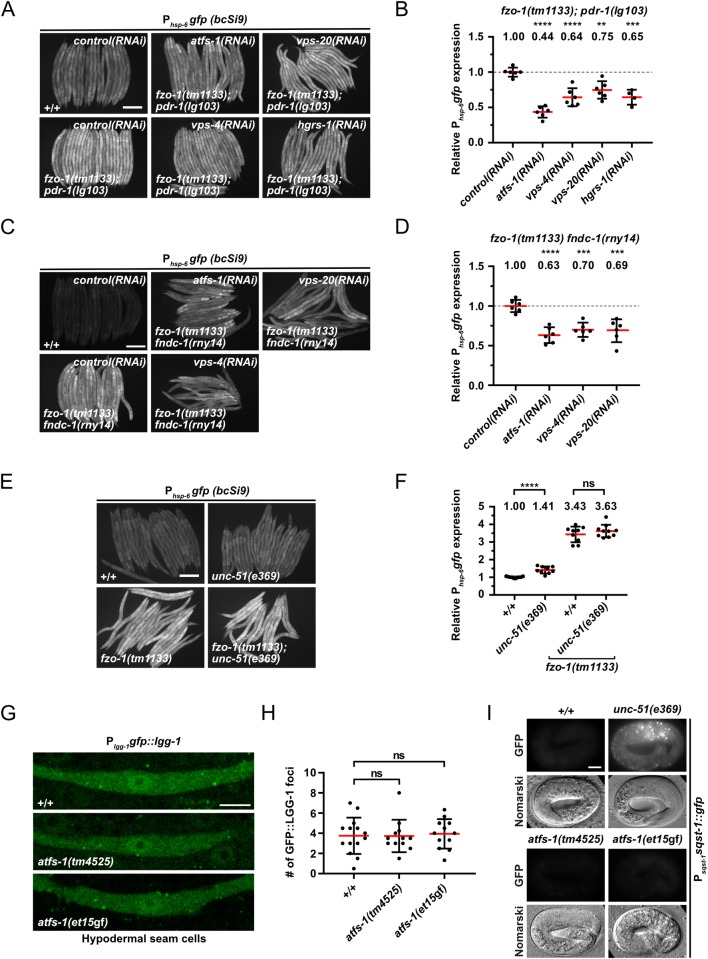
Fig 5. Functional interactions between mitophagy, autophagy and UPRmt.
(A) L4 larvae of fzo-1(tm1133); pdr-1(lg103) expressing Phsp-6gfp (bcSi9) were subjected to control(RNAi), atfs-1(RNAi), vps-4(RNAi), vps-20(RNAi) or hgrs-1(RNAi) and the F1 generation was imaged. Scale bar: 200 μm. (B) Quantifications of fluorescence images from panel A. After subtracting the mean fluorescence intensity of wild type (+/+) on control(RNAi), the values were normalized to fzo-1(tm1133); pdr-1(lg103) on control(RNAi). Each dot represents the quantification of fluorescence intensity of 15–20 L4 larvae. Values indicate means ± SD of 3 independent experiments in duplicates. **P<0.01, ***P<0.001, ****P<0.0001 using one-way ANOVA with Dunnett’s multiple comparison test to control(RNAi). (C) L4 larvae of fzo-1(tm1133) fndc-1(rny14) expressing Phsp-6gfp (bcSi9) were subjected to control(RNAi), atfs-1(RNAi), vps-4(RNAi) or vps-20(RNAi) and the F1 generation was imaged. Scale bar: 200 μm. (D) Quantifications of fluorescence images from panel C. After subtracting the mean fluorescence intensity of wild type (+/+) on control(RNAi), the values were normalized to fzo-1(tm1133) fndc-1(rny-14) on control(RNAi). Each dot represents the quantification of fluorescence intensity of 15–20 L4 larvae. Values indicate means ± SD of 3 independent experiments in duplicates. ***P<0.001, ****P<0.0001 using one-way ANOVA with Dunnett’s multiple comparison test to control(RNAi). (E) Fluorescence images of L4 larvae expressing Phsp-6gfp (bcSi9) in wild type (+/+), unc-51(e369), fzo-1(tm1133) or fzo-1(tm1133); unc-51(e369). Scale bar: 200 μm. (F) Quantifications of fluorescence images from panel E. Each dot represents the quantification of fluorescence intensity of 15–20 L4 larvae. Values indicate means ± SD of at least 4 independent experiments in duplicates. ns: not significant, ****P<0.0001 using two-tailed t-test. (G) Plgg-1gfp::lgg-1 expression in hypodermal seam cells of wild type (+/+), atfs-1(tm4525) or atfs-1(et15gf) L4 larvae. Scale bar: 5 μm. (H) Quantification of GFP::LGG-1 foci in hypodermal seam cells from panel G. Each dot represents the average amount of GFP::LGG-1 foci counted from 2–5 seam cells in one animal. n≥12 for each genotype; values indicate means ± SD; ns: not significant using one-way ANOVA with Dunnett’s multiple comparison test to wild type (+/+). (I) Nomarski and fluorescent images of the Psqst-1sqst-1::gfp translational reporter in embryos of wild type (+/+), atfs-1(tm4525) or atfs-1(et15gf) animals. As a positive control for a block in autophagy, unc-51(e369) was used. Representative images of >60 embryos are shown. Scale bar: 10 μm.

