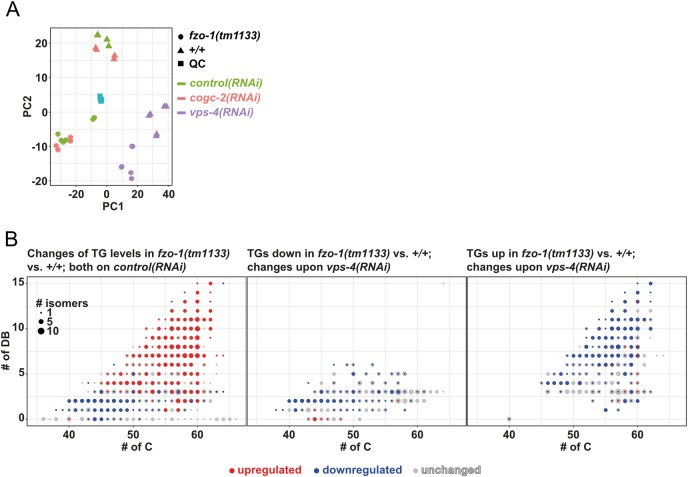
Fig 7. Induction of autophagy upon vps-4(RNAi) changes the levels of specific TGs in fzo-1(tm1133) mutants.
(A) Principal component analysis (PCA) scores plot of wild-type (+/+) and fzo-1(tm1133) animals subjected to control(RNAi), cogc-2(RNAi) or vps-4(RNAi). Turquois squares indicate internal quality controls (QC). (B) Scatterplot indicating the distribution and changes in the levels of TG species in fzo-1(tm1133) mutants in comparison to wild type (+/+). The x-axis labels the number of carbons (# of C) and the y-axis the number of double bonds (DB) in the acyl sidechains. The size of a dot indicates the number of detected isomers for a specific sum composition. Grey dots represent all detected TGs species and blue and red dots indicate down- (blue) or upregulation (red).

