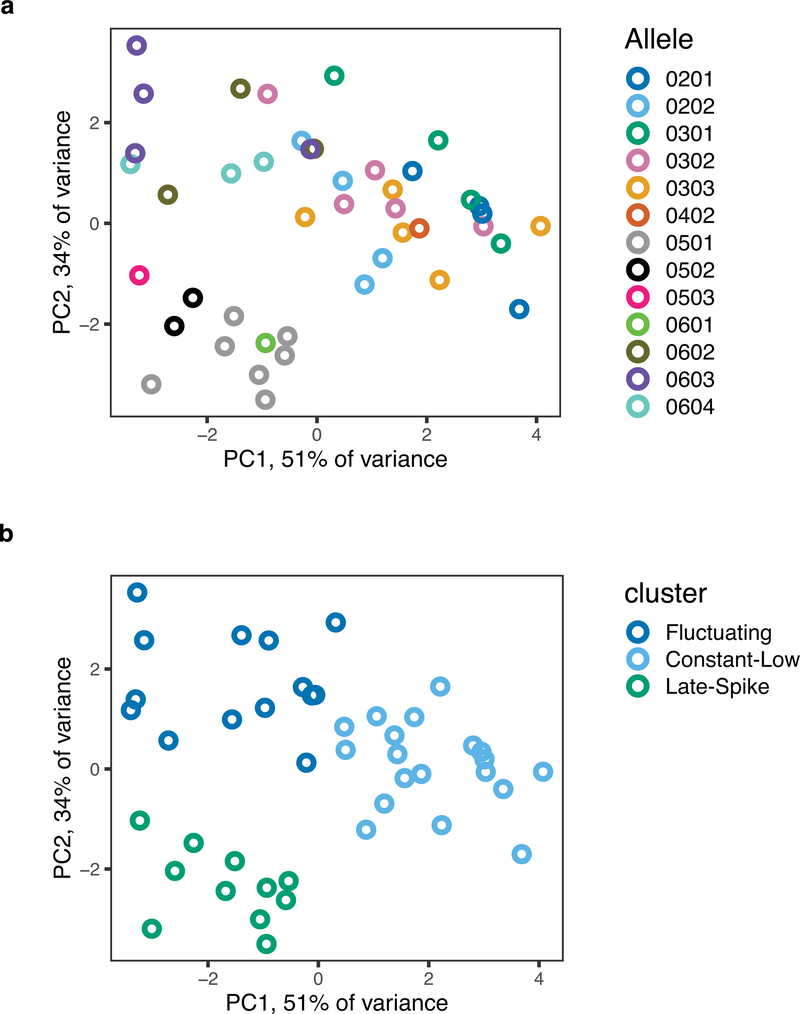
Extended Data Fig. 7. Principal component analysis of HLA-DQB1 allelic profiles over time.
PCA performed for 48 HLA-DQB1 allelic expression profiles of 24 individuals (log2(FPKM+1) values over time. Allelic profiles are colored by 4-digit classical HLA-DQB1 allele (a), and by the k-means cluster to which they belong (b). Average allelic expression was computed for samples with replicates. Twelve hour time point was removed because of high number of missing values. These plots depict how 4-digit alleles group near each other (a), and how PCA also captures the three distinct cis regulatory programs (Fluctuating, Constant-Low and Late-Spike) (b).

