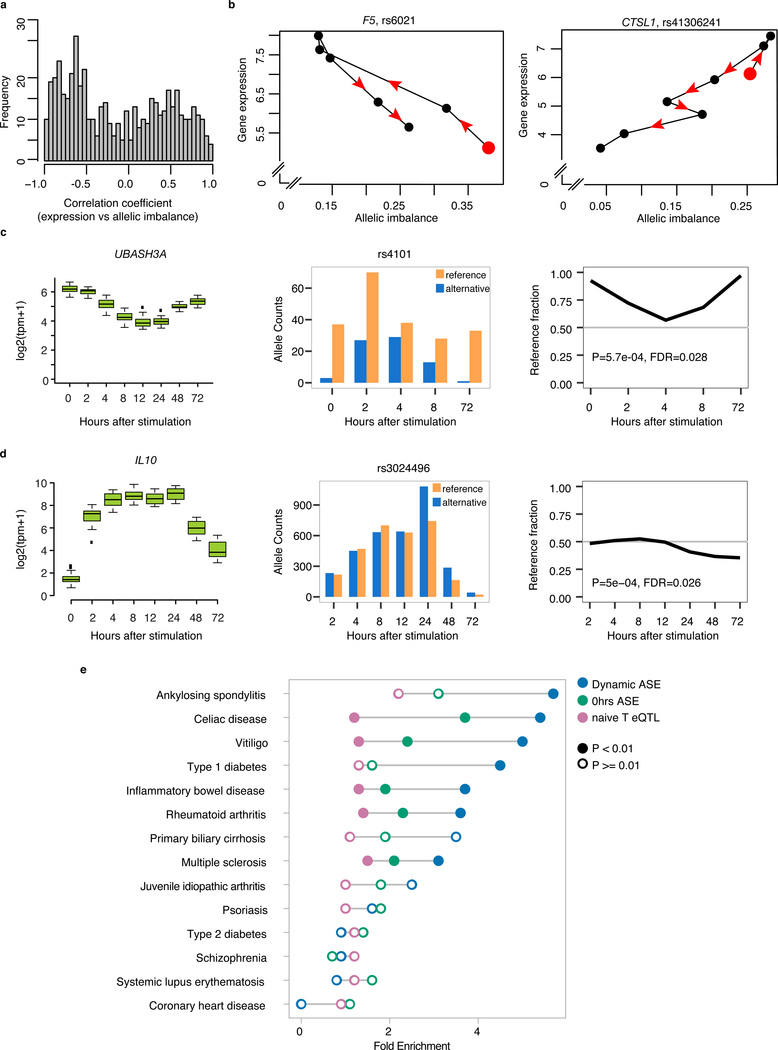
Fig. 2. Dynamic allele-specific expression patterns and enrichment in autoimmune disease loci.
(a) Spearman correlation coefficient between gene expression levels (log2(tpm +1)) and SNP allelic imbalance (distance to 0.5 reference fraction) across time for all dynASE events at 5% FDR. (b) Specific examples of allelic imbalance for a heterozygous SNP in an individual, associated with the expression levels log2(tpm+1) of its gene. Red dot indicates 0 hour time point. Consecutive time points are connected by solid lines, arrows indicate direction of time. (c-d) DynASE examples for two autoimmune disease genes. N = 24 for gene expression, 1 for ASE. (e) Fold enrichment of dynASE genes (blue) in risk loci for autoimmune diseases and 3 non-immune mediated diseases, using 1000 null sets of loci matched by number of loci per disease and number of genes per locus. Same for genes with significant ASE at 0 hours (green), and naive T cell eQTL genes (pink). Filled circles mark permutation P < 0.01, empty circles mark permutation P > 0.01.

