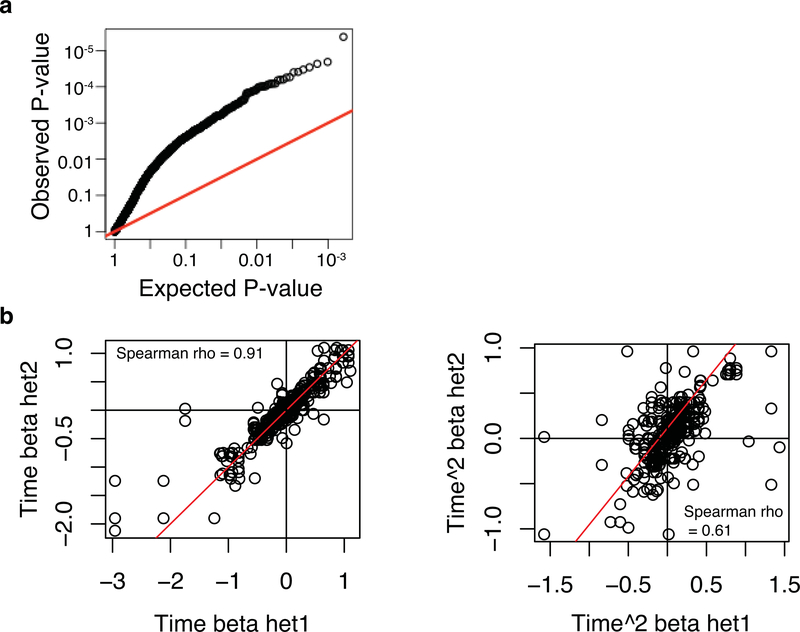
Extended Data Fig. 3. Reproducibility of dynASE across heterozygous individuals for the same SNP.
Here we wanted to assess whether dynamic ASE replicates well in different heterozygous individuals for the same SNP. First, from the 561 dynASE events at 5% FDR we took the top 356 unique SNPs (ensuring one heterozygous individual per SNP), and then asked how do the P-values look in other heterozygous individuals for those 356 SNPs. (a) Qqplot depicting the observed P-values in the other heterozygous individuals (y-axis), compared to the expected uniform distribution of P-values (x-axis). (b) Next, within all 561 significant events at 5% FDR, we evaluated the correlation of betas for time (left) and time squared (right) for all pairwise combinations of heterozygous individuals for the same SNP, i.e. het1 and het2 in x and y axis labels.

