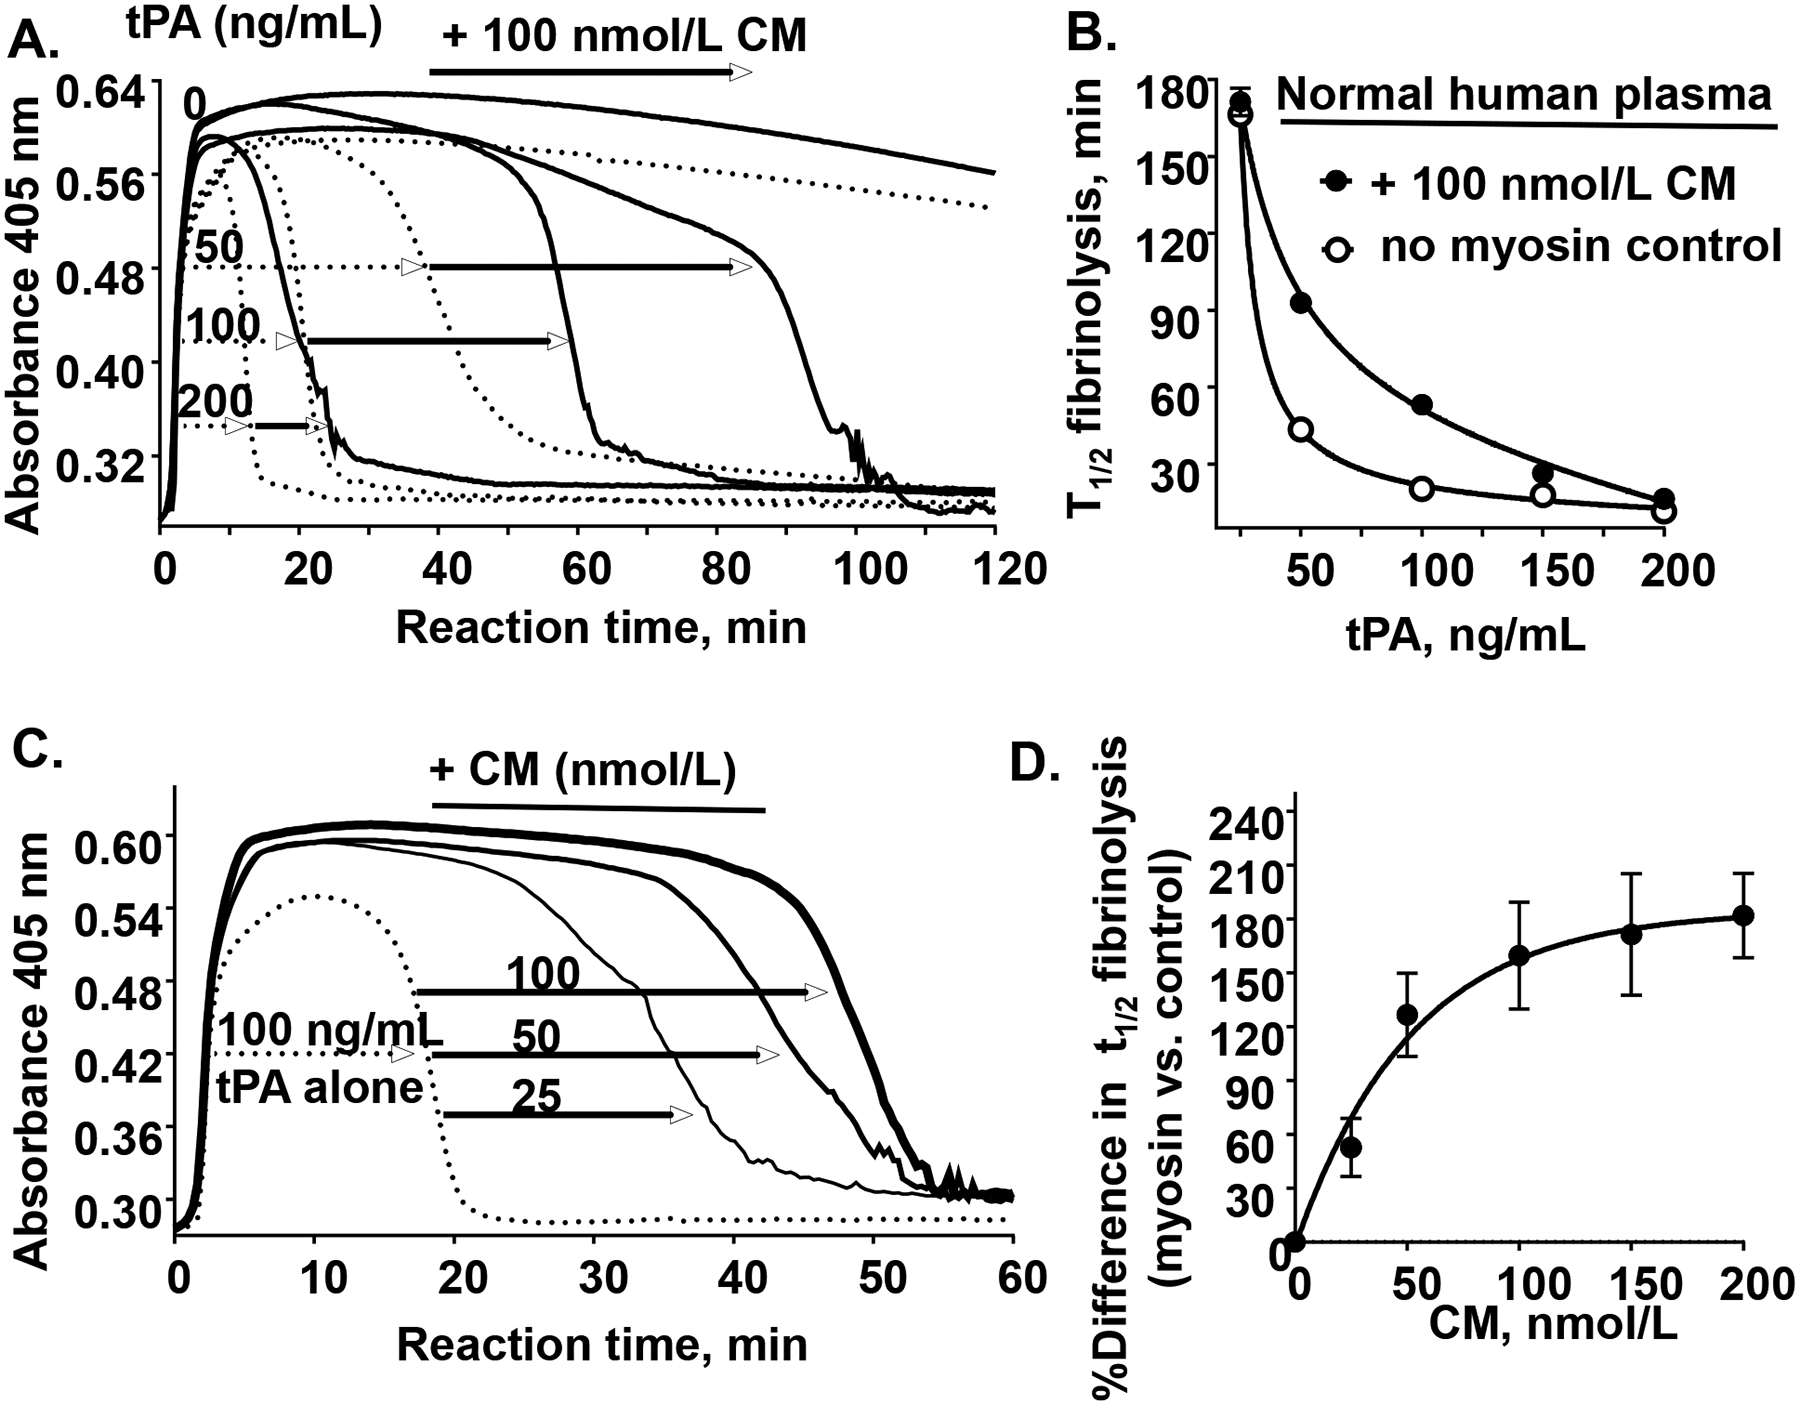
Figure 6. CM attenutes tPA-induced plasma clot lysis.

(A) As described in Materials and Methods, a 100 μL aliquot containing thrombin, Ca2+, phospholipid vesicles (60% PC: 20% PS: 20% PE), 0.1% BSA and different levels of tPA (as indicated, 0, 50, 100, or 200 ng/mL) was added to a 100 μL aliquot containing citrated normal human pooled plasma which had been pre-incubated for 30 min at 37 °C with CM (100 nmol/L) (solid lines) or control buffer (dotted lines). Following rapid mixing, the reaction mixture was monitored for turbidity at 405 nm at 37°C for 180 min during which a clot was rapidly formed (turbidity increase) and then that clot was subsequently lysed (turbidity decrease). (B) The plasma clot lysis time (t1/2, min for 50 % clot lysis) was quantified in the presence of CM (●) at different tPA levels or control buffer (○). Each value represents the mean [SD] of triplicate determinations. (C) Plasma was pre-incubated with different amounts of CM (as indicated, 0, 25, 50, or 100 nmol/L) followed by thrombin-initiated clot formation (as above), and the clot was lysed in the presence of 100 ng/mL tPA. (D) The percent difference in plasma clot lysis (t1/2) between values for the presence of CM at the indicated concentrations are shown where the plasma clot lysis time at no CM was defined as 100%. Each value represents the mean [SD] of at least triplicate determinations.
