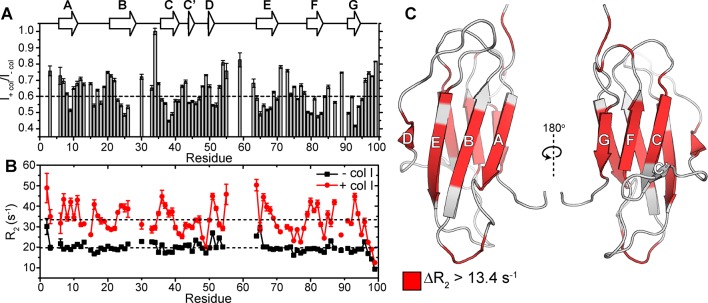
Figure 2.
Characterizing residue-specific β2m–collagen I binding through 15N-R2 measurements. (A) Amide backbone signal intensity ratios from 1H–15N HSQC spectra of 300 μM β2m in the presence of 1.2 mg/mL collagen I compared with values in the absence of collagen I (gray bars). The dashed line is drawn at the average signal intensity ratio over the entire protein. Dips in the signal intensity reflect regions maximally perturbed by the presence of collagen I. Error bars are propagated from the noise level of the spectra. The secondary structural elements of β2m are indicated above the plot. (B) 15N-R2 measurements of 300 μM β2m in the presence (red) or absence (black) of 1.2 mg/mL collagen I. The errors are propagated from the fitting errors. The dashed lines indicate the mean 15N-R2 values of β2m in the presence or absence of 1.2 mg/mL collagen I over the entire protein. All experiments were conducted in TBS, pH 7.4 containing 0.5 mg/mL casein as a nonspecific binding blocking agent at 10 °C. Note that in these conditions, several residues in the DE loop do not have observable peak intensities in the 1H–15N HSQC spectrum due to inherent conformational exchange, consistent with previous results.49 (C) Solution NMR structure of the WT-β2m monomer (PDB: 2XKS)49 highlighting residues that show an increase in 15N-R2 higher than 13.4 s–1 (the mean Δ15N-R2) upon addition of 1.2 mg/mL collagen I.

