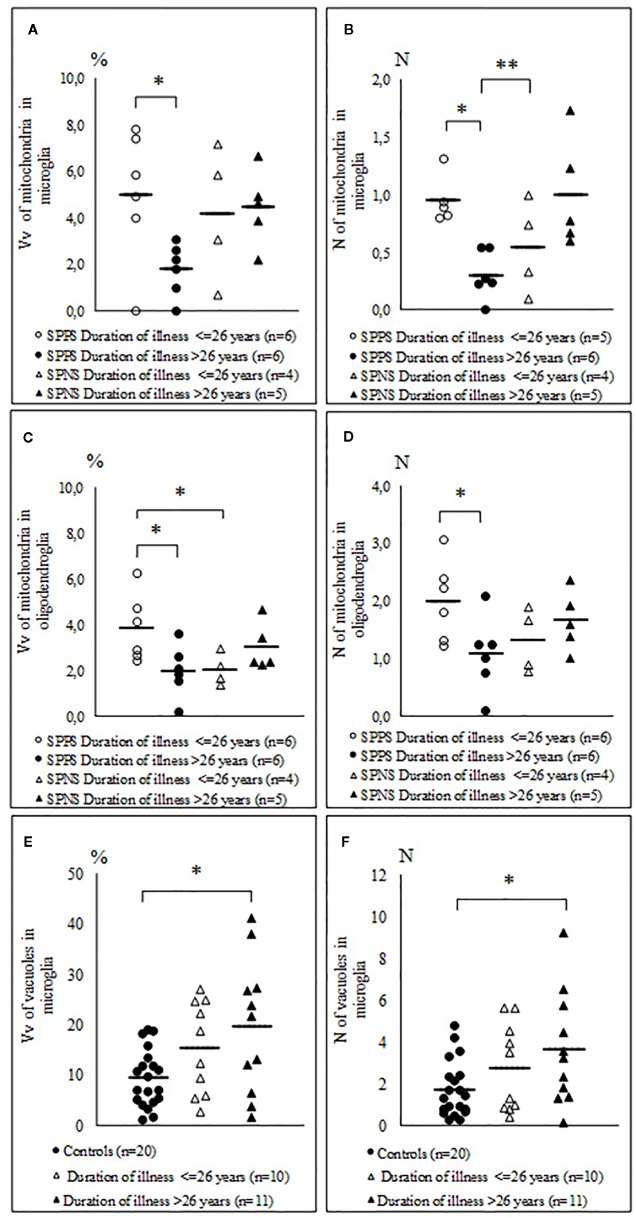
Figure 6.
Individual and mean values for Vv and N of mitochondria in microglia (A, B), in oligodendrocytes (C, D) in the SPPS and SPNS subgroups with shorter (< 26 years) and longer (> 26 years) duration of disease and Vv and N of vacuoles in microglia in the subgroups with shorter (< 26 years) and longer (> 26 years) duration of disease as compared to the control group (E, F). *p < 0.05; **p < 0.01.

