Abstract
Transthoracic echocardiography (TTE) evaluation of aortic stenosis (AS) is routinely performed using the continuity equation. Inaccurate measurements of the left ventricular (LV) outflow tract (LVOT) diameter are considered the most common source of error in AS grading. We hypothesized that inconsistency in LVOT velocity time integral (VTI) is an under-recognized cause of AS assessment error. We sought to determine which parameters contribute most towards inconsistencies in AS grading by studying the prevalence of different errors in a historic cohort. We identified patients with mild to severe AS with multiple studies from our database from 1994 to 2018 (n = 988 patients, 2859 studies). Errors were defined when: (1) LVOT diameter changed by > 2 mm, (2) LVOT VTI changed by > 15% without change in LV function from the initial TTE, (3) aortic valve (AV) maximum velocity (Vmax), mean pressure gradient (ΔP) or AV VTI decreased by > 15% without change in LV function from prior study. The most common error was the LVOT VTI measurement with 22% prevalence. LVOT diameter, AV VTI, AV Vmax and AV ΔP measurement caused errors in < 7% studies. Patients with normal LV function and more severe AS were more likely to have LVOT VTI errors (P < 0.05). LVOT VTI is a frequent, under-recognized source of error in assessing AS. Greater attention should be directed toward the proper positioning of the pulsed Doppler sample volume, particularly in patients with higher grades of AS and normal systolic function, to ensure accurate and reproducible assessment of AS.
Keywords: Valvular heart disease, Aortic stenosis, Doppler echocardiography, Left ventricular outflow tract
Introduction
Aortic stenosis (AS) is a degenerative process of progressive fibro-calcific remodeling and thickening of the aortic valve leaflets causing obstruction of blood flow. Unlike regurgitant lesions, which may be markedly altered in severity by varying loading conditions, AS is a progressive disease that fails to improve unless a mechanical intervention is performed [1–3]. AS is the most common valvular heart disease in the developed world and its prevalence is growing due to longer life expectancies [4]. With the emerging utilization of transcatheter aortic valve replacement procedures, especially in the moderate-risk population, the need to accurately and reproducibly assess the severity of AS in order to optimally manage and time interventions is critical.
Currently, quantitative assessment of AS is done almost entirely using transthoracic echocardiography (TTE), which also provides information regarding leaflet number, mobility, and degree of calcification. Prior to TTE, the gold standard assessment of the aortic valve (AV) hemodynamics and estimating aortic valve area (AVA) was performed in the catheterization laboratory by directly measuring the transaortic gradient and calculating the AVA using the Gorlin equation [5]. Assessment of AS with TTE was first described in 1980 using the modified Bernouilli equation to estimate the peak pressure across the AV in order to determine whether the AS was moderate or severe [6] and was subsequently validated against invasive data [7, 8]. Using echocardiographic parameters also allows the calculation of AVA based on the principle of conservation of mass. The AVA is routinely derived using the continuity equation as the flow through the left ventricular outflow tract (LVOT) is equal to that through the AV [9]. By measuring the LVOT diameter to calculate cross-sectional area and the LVOT and the AV velocity–time integrals (VTI), the AVA is derived and has been extensively validated against invasive AVA measurements [10].
Traditionally, inaccuracies in the measurement of LVOT diameter have been cited as the most common source of error in grading AS, particularly since any errors in this measurement are taken to the second power in the continuity equation [11]. Recently, there has been an abundance of research focused on the delineation of LVOT morphology using multimodality imaging, and its associated impact on estimated AVA [12, 13]. However, it is plausible that inconsistencies in the other components of the continuity equation could account for inaccuracies in the quantification of AS severity. We hypothesized that misplacement of the pulsed-wave Doppler sample volume in the LVOT may be an under-recognized cause of inaccuracy in AVA estimation.
Accordingly, the primary aim of this study was to determine how frequently errors in the calculation of AVA in clinical practice are due to each of the parameters used in the continuity equation, namely LVOT diameter, LVOT pulsed Doppler LVOT VTI, and AV continuous wave Doppler VTI. Our secondary aim was to determine whether there is a patient phenotype in which errors in the assessment of AS and calculation of AVA are more prevalent.
Methods
Patient population
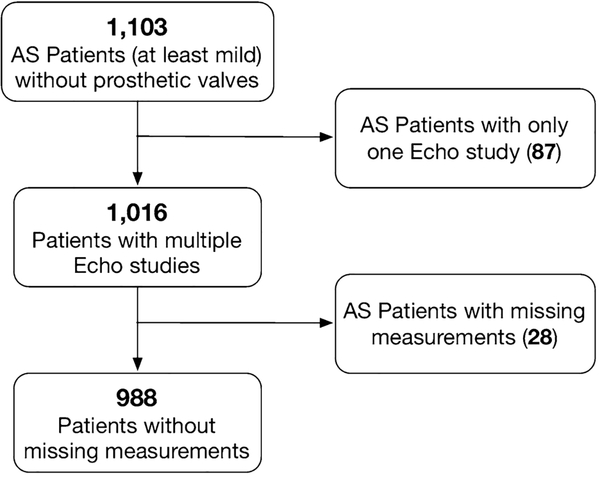
We identified patients from our echocardiographic database dating from its beginning in 1994 through 2018 with mild to severe AS who had multiple studies using diagnostic finding codes (Fig. 1). Patients with mechanical or bioprosthetic aortic valves were also excluded. There was no minimum or maximum duration of time set between TTE studies. The study was approved by the Institutional Review Board with a waiver of consent.
Fig. 1.
Flowchart of inclusion and exclusion of participants in the study
Study parameters
Age, gender, and body surface area (BSA) at the time of the initial study were obtained from the echocardiographic database. AV parameters were extracted from the digital TTE reports, including LVOT diameter measured in mid-systole in the parasternal long axis view. In our standard TTE assessment of AS, the aortic valve and LVOT VTIs are routinely measured offline (Philips Xcelera, Andover, MA) from the apical 3- and 5-chamber views. It is our laboratory’s protocol to align the continuous wave Doppler of the AV VTI as close to parallel with flow as possible, use the highest maximum velocity (Vmax) and the highest AV VTI from any of the transducer positions. A Pedof transducer was used in the majority of patients. When there was more than one measurement of the LVOT diameter or the LVOT VTI saved in the digital report, the average was used in the calculation of AVA.
Definition of errors
Errors in the assessment of AS severity were defined when physiologically implausible findings were reported on a subsequent TTE study, including: (1) the LVOT diameter changed (either increased or decreased) by > 2 mm from the initial measurement, since this should not change as the patient ages; (2) LVOT VTI changed by > 15% in the absence of a change in LV function compared to the initial study, as this parameter should remain similar in the setting of stable LV systolic function; (3) AV Vmax, mean pressure gradient (ΔP) or AV VTI decreased by > 15% relative to the prior study, as these parameters may increase in the natural history of AS but should not normally decrease. An error was excluded if between consecutive TTE studies, left ventricular systolic function decreased by one or more grades, e.g. normal (ejection fraction 52% or greater), mildly reduced (41–51%), moderately reduced (30–40%), and severely reduced (less than 30%), since a decrease in ventricular systolic performance can account for changes in aortic valve hemodynamics and therefore calculated AVA. A cutoff of 15% change was chosen, as a lower cut-off value would fall within the margin of typical echocardiographic measurement error. Because it is difficult to determine whether the initial or the follow-up measurement was inaccurate, inter-measurement discrepancy as defined above, was counted as an error when detected.
Statistical analysis
For each measurement error, the frequency was expressed as the mean and 95% confidence intervals. In order to determine whether the presence of certain demographic or echocardiographic findings would increase the likelihood of different AS assessment errors, we divided the studies based on the presence or absence of that error. Subgroup analysis was performed based on age, gender, BSA, proportion of LV systolic dysfunction and proportion of severe AS grade. Comparisons between groups were performed using two-tailed unpaired Student’s t test. P values < 0.05 were considered significant.
Results
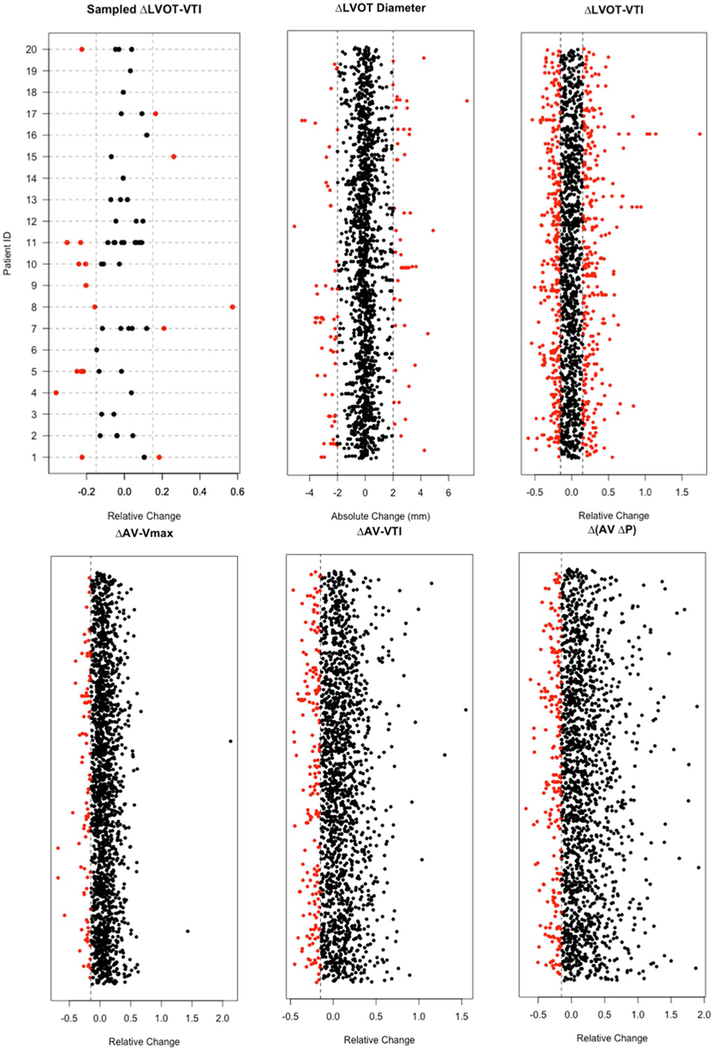
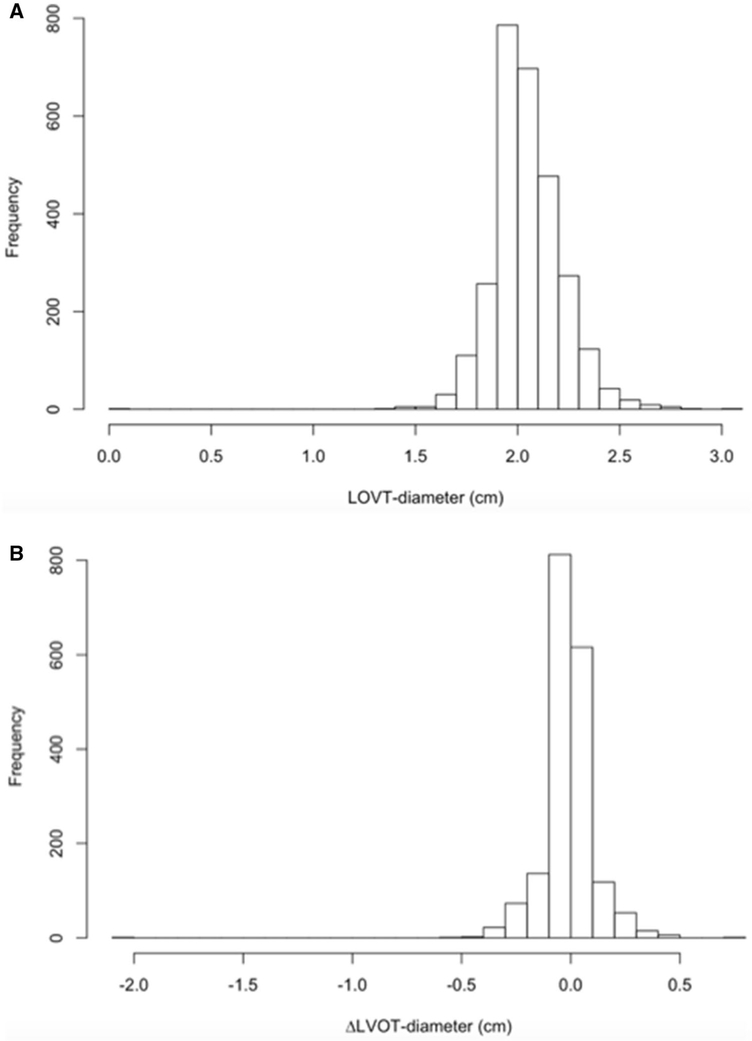
We identified 988 patients who met the inclusion criteria, corresponding to a total of 2859 TTE studies. The mean time between two consecutive examinations was 17 ± 14 months. Using the above definitions, the most frequent error was that of the LVOT VTI measurement with 22% of studies exhibiting discrepant values. The remaining parameters of the continuity equation and AS severity assessment (LVOT diameter, AV VTI, AV Vmax and AV ΔP) all demonstrated less than 7% measurement errors (Table 1). Figure 2 shows the distributions of differences between consecutive examinations in individual patients for each of the parameters. These plots demonstrate that: (1) error occur in all five parameters, (2) they are bi-directional for LVOT VTI and LVOT diameter, and (3) their prevalence is markedly higher for LVOT VTI, compared to the other four parameters. Knowing that the LVOT dimension should not change between studies, we also generated histograms that show how frequently changes of different magnitudes were actually detected between serial exams (Fig. 3). These histograms showed that in the vast majority of patients, LVOT diameter was between 1.6 and 2.7 cm, and that the percentage of patients with a change of > 3 mm was negligible.
Table 1.
Error definitions and frequency in our study population
| Error criteria | Measurement errors n, (mean, 95%CI) | |
|---|---|---|
| LVOT diameter (mm) | │Δ│ > 2 mm | 130 (4.6%, [3.8%, 5.3%]) |
| LVOT VTI (cm) | │Δ│ > 15% | 628 (22.0%, [20.4%, 23.5%]) |
| AV Vmax (m/s) | Δ < − 15% | 92 (3.2%, [2.6%, 3.9%]) |
| AV VTI (cm) | Δ < − 15% | 182 (6.4%, [5.5%, 7.3%]) |
| AV ΔP (mmHg) | Δ < − 15% | 156 (5.5%, [4.6%, 6.3%]) |
LVOT left ventricular outflow tract, VTI velocity time integral, AV aortic valve, Vmax maximum velocity, ΔP mean pressure gradient
Fig. 2.
Distributions of measurement differences between consecutive examinations in individual patients. Except for LVOT diameter, which are absolute changes from the reference, all the changes of other measurements are relative changes from the reference. The dots on the same row indicate multiple measurements in the same patient. To better illustrate this, we randomly sampled 20 patients and show the distribution of their LVOT VTI measurement differences from the reference (on the same horizontal dashed line). Some rows only have one dot as a dot represents the difference in a pair of TTE studies. Red dots indicate erroneous measurements according to the preset cutoffs depicted by vertical dotted lines (see text for details)
Fig. 3.
Distribution of measured LVOT diameter (a) and changes in this parameter between consecutive studies (b)
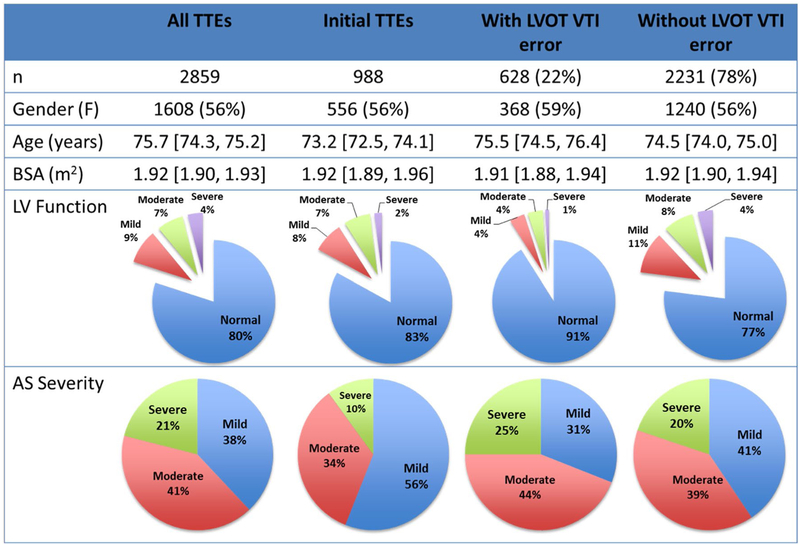
There were 628 TTEs (22%) with and 2231 TTEs (78%) without a change of > 15% LVOT VTI values between studies. According to subgroup analysis, there were no significant intergroup differences in age, gender, or BSA. In a sub-analysis of the TTEs with LVOT VTI errors based on LV systolic function and severity of AS, the TTEs with an LVOT VTI error of > 15% were more likely to be associated with normal LV systolic function (p < 0.0001). Additionally, patients with LVOT VTI errors had higher prevalence of severe AS (p = 0.0037) compared to those without discrepancies, who tended to have less than severe AS (Fig. 4).
Fig. 4.
Transthoracic echocardiograms cohorts by demographics, left ventricular systolic function, and aortic stenosis severity
Since LVOT diameter error is frequently referred to as the most common potential source of error, subgroup analysis showed that for TTEs with (n = 130, 4.6%) and without (n = 2729, 95.4%) LVOT errors, there was no significant difference in age, gender or BSA. Likewise, there was no difference in the prevalence of severe AS. The patients with normal systolic function had a higher prevalence of LVOT diameter errors than those with LV dysfunction (p = 0.003).
Because guidelines recommended partitions of LV EF are rather wide, and, as a result, changes in this parameter may be underappreciated when they remain within the same LV function category, we performed another subgroup analysis to better understand the potential influence of LV EF changes on the frequency of LVOT VTI errors. Data were reanalyzed for the patients with quantitative EF values in their reports without using grades of LV function (namely normal, mildly, moderately or severely reduced, according to the aforementioned severity ranges), but using instead absolute change in EF of different magnitudes for error exclusion. As one would expect, the frequency of LVOT VTI errors was considerably higher when allowing greater absolute change in EF: 8, 13, 18 and 21% for EF change of 5, 10, 15 and 20%, respectively.
Discussion
The purpose of this study was to identify the prevalence of the most common errors in the echocardiographic assessment of AS severity, which is of significant clinical importance, as the timing of interventions relies heavily on TTE. In a large historic cohort of patients who underwent serial TTE evaluations of AS severity, we found that LVOT VTI is a vastly under-recognized source of error, when calculating AVA using the continuity equation. This study underscores the need for careful attention to correct positioning of the LVOT VTI sample volume in this patient population. Our findings also indicate that this error is associated with more severe AS and the presence of preserved LV systolic function.
The first step in calculating an accurate and reproducible AVA is to ensure that all the components of the continuity equation are acquired and measured correctly. Most attention has been directed towards the LVOT diameter measurement as the major contributing factor towards AVA error, frequently citing the impact of squaring the LVOT diameter to calculate cross-sectional area [11, 12]. Current guidelines recommend measuring the LVOT diameter in the zoomed parasternal long-axis view in mid-systole from inner edge to inner edge [14]. However, LVOT remodeling in the setting of severe AS is known to show less distensibility, resulting in greater systolic ellipticity, which predisposes to underestimation of cross-sectional area [15]. Furthermore, as the cross-sectional area sampled within the LVOT approaches the aortic valve annulus, the shape has been described as funnel or elliptical and more cylindrical, resulting in a better correlation with 3-dimensional measurements [16]. The recently updated focused guidelines from the American Society of Echocardiography are ambiguous in the recommendation on where exactly to measure the LVOT diameter. Some experts recommend 3–10 mm below the annulus level, while others advocate measuring at the annular level [14]. The rationale for measuring 3–10 mm below the annulus is derived from the fact that in order for the continuity equation to be accurate, the pulsed Doppler sample volume should be in the identical anatomic plane in which the cross-sectional area is calculated. Our findings show that LVOT diameter errors are relatively uncommon. This is perhaps due to the widespread awareness of the impact that this measurement has on AVA accuracy, with increased cognizance on the part of both sonographer and interpreting cardiologist to accurately acquire and consistently measure LVOT diameter in consecutive studies.
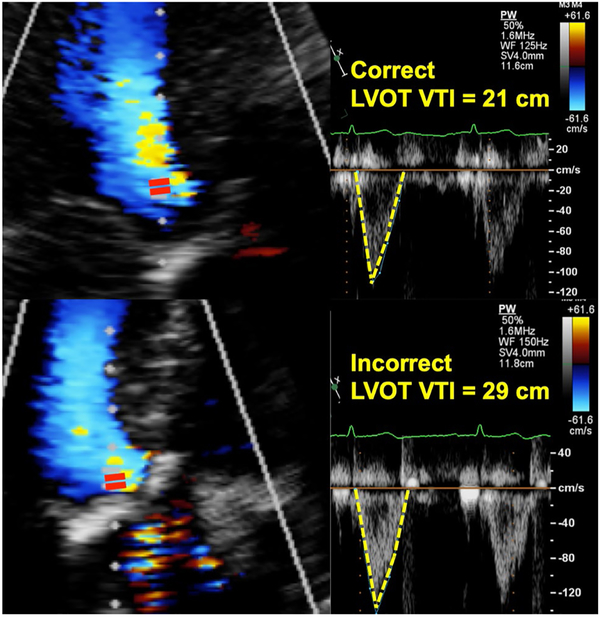
Interestingly, we observed the inconsistent placement of the pulsed Doppler sample volume in the LVOT as the greatest source of error in the calculation of AVA (22% of the cases). In AS, at the level of the aortic annulus, the LVOT VTI may be falsely high due to contamination by the high velocity in accelerating sub-valvular funnel. The current guidelines recommend positioning the LVOT VTI sample volume just proximal to the region of flow acceleration, moving the sample-volume carefully back further into the LVOT until there is a smooth velocity curve with a well-defined peak and narrow velocity range at the peak velocity. This finding is likely due to the incorrect positioning of the pulsed Doppler sample volume too close to the AV, resulting in a “hybrid” VTI between the LVOT and AV, which is higher than the true LVOT VTI (Fig. 5). The hybrid VTI has a wider and higher velocity range than the true LVOT VTI which has a characteristically narrow, more laminar flow profile. This hybrid VTI results in overestimation of AVA derived by the continuity equation, but has no impact on the AV Vmax or mean trans-aortic ΔP, the other two parameters needed to assess AS severity, as these are derived only from the aortic valve VTI.
Fig. 5.
Placement of the pulsed Doppler sample volume in the correct (upper) location, resulting in a characteristic narrow (top), laminar LVOT VTI flow curve profile versus the incorrect placement too close to the stenotic aortic valve, resulting in a falsely elevated “hybrid” LVOT VTI (bottom)
Also, one should consider the relationship between our definition of error (or non-physiologic measurement discrepancies) for LVOT VTI and the use of the guidelines-based grades of LV function. This is because LVOT VTI values were stratified based on these grades that correspond to rather wide ranges of LV EF, which could potentially result in misclassification of some patients as “errors”. It is impossible to rule out that this issue might have contributed to our findings that LVOT VTI had the greatest variation between serial studies and that the greatest degree of discrepancies was found with measurements in the normal range of LV EF, defined in the guidelines is a broad EF range of 52–72%. Indeed, we found that when specific changes in EF within narrow ranges are used to define “no change in LV function” in lieu of the conventional guidelines-recommended definitions, the frequency of LVOT VTI errors was significantly lower. This finding underscores the importance of LV EF in the evaluation of AS severity, and indicates that a more granular way of defining changes in LV EF to facilitate interpreting the identified changes in VTI might potentially affect the findings of our study. Nevertheless, this was a retrospective study based on reported measurements that were performed according to the guidelines, and may thus reflect what happens in other clinical labs that follow this approach.
The prevalence of AV Vmax, AV VTI, and AV ΔP errors was low in our study. This is a likely result of using multiple transducer positions with careful adjustments to minimize the intercept angle between the direction of flow and the Doppler angle. Any angle greater than zero is nonparallel to flow, subject to the cosine effect and will lead to an underestimation of the AV Vmax, AV VTI, and AV ΔP, and consequently AS severity [14]. Our laboratory’s protocol emphasizes selecting the maximal velocity and tracing the associated dense velocity curve as recommended in the guidelines. This is a longstanding laboratory standard, which has been established before the time window of this study.
We found that patients with severe AS and normal LV systolic function demonstrated higher rates of LVOT VTI errors. We postulate that the greater prevalence of errors in the severe AS cohort may be due to the higher AV VTI seen in severe versus non-severe AS. This occurs because when the pulsed Doppler sample volume is positioned too close to the area of turbulent flow, it has a greater impact on skewing the hybrid VTI and therefore may cause discrepancies of > 15% between studies. Additionally, patients with normal systolic function and AS have larger AV pressure gradients than patients with systolic dysfunction. The higher AV ΔP in normal systolic function studies may have a greater effect on contaminating a hybrid VTI if the LVOT pulsed Doppler sample volume is misplaced resulting in more discrepancies of > 15% between studies.
Importantly, we found no impact of severity of AS on LVOT diameter errors. The higher prevalence of LVOT errors in studies of patients with normal systolic function may be a result of greater ventricular contraction generating more LVOT distensibility and therefore diameter variation in systole, compared to studies with LV systolic dysfunction. In a study of 110 patients undergoing electrocardiogram-gated cardiac computed tomographic angiography, the anterior–posterior LVOT diameter increased nearly 2 mm in systole (22.68 ± 3.09 mm) compared to diastole (20.77 ± 2.93 mm) [17]. In a multimodality study of multidetector computed tomography, 3-dimensional and 2-dimensional echocardiography in 22 patients, the LVOT area increased in all three modalities in mid-systole versus end-diastole [18].
Limitations
The limitations of this study include its single center nature, which makes our findings not necessarily generalizable to the experience of other laboratories. The retrospective study design has well-known limitations of lack of standardization in potentially important variables, such as time intervals between consecutive examinations, equipment upgrades over the years, and different methods of assessment of LV systolic function, which in some of the studies included qualitative estimations.
An inherent limitation in the continuity equation is the assumption that the LVOT is circular and there is a uniform velocity profile across the LVOT, despite evidence of a slightly skewed velocity profile with highest values located in the center of the LVOT toward the septum in both normal subjects and patients with AS [19]. We understand that even in the presence of stable LV systolic function, there can be alterations in the LVOT VTI due to changes in loading conditions and heart rate, although expectedly below the 15% threshold used in this study. Compared to the Teichholz method and the Simpson’s biplane method of determining cardiac output, the VTI method has the lowest beat-to-beat variability [20].
Finally, the assumption that that LVOT dimension should not change between studies would theoretically require any change in diameter > 0 mm to be considered as an error. We chose to follow a less strict definition of change in > 2 mm as an error instead, in order to take into account the finite precision of these measurement and the reasonable inter-measurement variability. It is likely that this choice has impacted our finding of the relatively prevalence of LVOT dimension error.
Conclusions
The most frequent source of discrepancy in the estimation of AVA between studies in a single patient is in the assessment of LVOT VTI. Discrepancies in LVOT diameter measurement, in comparison, are less common. The standard Doppler evaluation of AV (VTI, Vmax, and ΔP) yields a low rate of errors, if sampled from multiple transducer positions. Greater attention should be directed toward the proper positioning of the pulsed Doppler sample volume in the LVOT, particularly in patients with higher grades of AS and preserved LV systolic function, to ensure accurate and reproducible assessment of AS.
Footnotes
Conflict of interest All authors declare that they have no conflict of interest.
Compliance with ethical standards
Ethical approval All procedures performed in studies involving human participants were in accordance with the ethical standards of the institutional and/or national research committee and with the 1964 Helsinki declaration and its later amendments or comparable ethical standards.
Informed consent The study was approved by the Institutional Review Board.
Publisher’s Note Springer Nature remains neutral with regard to jurisdictional claims in published maps and institutional affiliations.
References
- 1.Cheitlin MD, Gertz EW, Brundage BH, Carlson CJ, Quash JA, Bode RS Jr (1979) Rate of progression of severity of valvular aortic stenosis in the adult. Am Heart J 98:689–700 [DOI] [PubMed] [Google Scholar]
- 2.Davies SW, Gershlick AH, Balcon R (1991) Progression of valvar aortic stenosis: a long-term retrospective study. Eur Heart J 12:10–14 [DOI] [PubMed] [Google Scholar]
- 3.Faggiano P, Aurigemma GP, Rusconi C, Gaasch WH (1996) Progression of valvular aortic stenosis in adults: literature review and clinical implications. Am Heart J 132:408–417 [DOI] [PubMed] [Google Scholar]
- 4.Eveborn GW, Schirmer H, Heggelund G, Lunde P, Rasmussen K (2013) The evolving epidemiology of valvular aortic stenosis. The Tromso study. Heart 99:396–400 [DOI] [PubMed] [Google Scholar]
- 5.Gorlin R, Gorlin SG (1951) Hydraulic formula for calculation of the area of the stenotic mitral valve, other cardiac valves, and central circulatory shunts. I. Am Heart J 41:1–29 [DOI] [PubMed] [Google Scholar]
- 6.Hatle L, Angelsen BA, Tromsdal A (1980) Non-invasive assessment of aortic stenosis by Doppler ultrasound. Br Heart J 43:284–292 [DOI] [PMC free article] [PubMed] [Google Scholar]
- 7.Callahan MJ, Tajik AJ, Su-Fan Q, Bove AA (1985) Validation of instantaneous pressure gradients measured by continuous-wave Doppler in experimentally induced aortic stenosis. Am J Cardiol 56:989–993 [DOI] [PubMed] [Google Scholar]
- 8.Smith MD, Dawson PL, Elion JL, Booth DC, Handshoe R, Kwan OL, Earle GF, DeMaria AN (1985) Correlation of continuous wave Doppler velocities with cardiac catheterization gradients: an experimental model of aortic stenosis. J Am Coll Cardiol 6:1306–1314 [DOI] [PubMed] [Google Scholar]
- 9.Skjaerpe T, Hegrenaes L, Hatle L (1985) Noninvasive estimation of valve area in patients with aortic stenosis by Doppler ultrasound and two-dimensional echocardiography. Circulation 72:810–818 [DOI] [PubMed] [Google Scholar]
- 10.Oh JK, Taliercio CP, Holmes DR Jr, Reeder GS, Bailey KR, Seward JB, Tajik AJ (1988) Prediction of the severity of aortic stenosis by Doppler aortic valve area determination: prospective Doppler-catheterization correlation in 100 patients. J Am Coll Cardiol 11:1227–1234 [DOI] [PubMed] [Google Scholar]
- 11.Michelena HI, Margaryan E, Miller FA, Eleid M, Maalouf J, Suri R, Messika-Zeitoun D, Pellikka PA, Enriquez-Sarano M (2013) Inconsistent echocardiographic grading of aortic stenosis: is the left ventricular outflow tract important? Heart 99:921–931 [DOI] [PubMed] [Google Scholar]
- 12.Gaspar T, Adawi S, Sachner R, Asmer I, Ganaeem M, Rubinshtein R, Shiran A (2012) Three-dimensional imaging of the left ventricular outflow tract: impact on aortic valve area estimation by the continuity equation. J Am Soc Echocardiogr 25:749–757 [DOI] [PubMed] [Google Scholar]
- 13.Clavel MA, Malouf J, Messika-Zeitoun D, Araoz PA, Michelena HI, Enriquez-Sarano M (2015) Aortic valve area calculation in aortic stenosis by CT and Doppler echocardiography. JACC Cardiovasc Imag 8:248–257 [DOI] [PubMed] [Google Scholar]
- 14.Baumgartner H, Hung J, Bermejo J, Chambers JB, Edvardsen T, Goldstein S, Lancellotti P, LeFevre M, Miller F Jr, Otto CM (2017) Recommendations on the echocardiographic assessment of aortic valve stenosis: a focused update from the European association of cardiovascular imaging and the American society of echocardiography. J Am Soc Echocardiogr 30:372–392 [DOI] [PubMed] [Google Scholar]
- 15.Mehrotra P, Flynn AW, Jansen K, Tan TC, Mak G, Julien HM, Zeng X, Picard MH, Passeri JJ, Hung J (2015) Differential left ventricular outflow tract remodeling and dynamics in aortic stenosis. J Am Soc Echocardiogr 28:1259–1266 [DOI] [PubMed] [Google Scholar]
- 16.Caballero L, Saura D, Oliva-Sandoval MJ, Gonzalez-Carrillo J, Espinosa MD, Garcia-Navarro M, Valdes M, Lancellotti P, de la Morena G (2017) Three-dimensional morphology of the left ventricular outflow tract: impact on grading aortic stenosis severity. J Am Soc Echocardiogr 30:28–35 [DOI] [PubMed] [Google Scholar]
- 17.Halpern EJ, Gupta S, Halpern DJ, Wiener DH, Owen AN (2012) Characterization and normal measurements of the left ventricular outflow tract by ECG-gated cardiac CT: implications for disorders of the outflow tract and aortic valve. Acad Radiol 19:1252–1259 [DOI] [PubMed] [Google Scholar]
- 18.Otani K, Takeuchi M, Kaku K, Sugeng L, Yoshitani H, Haruki N, Ota T, Mor-Avi V, Lang RM, Otsuji Y (2010) Assessment of the aortic root using real-time 3D transesophageal echocardiography. Circ J 74:2649–2657 [DOI] [PubMed] [Google Scholar]
- 19.Wiseth R, Samstad S, Rossvoll O, Torp HG, Skjaerpe T, Hatle L (1993) Cross-sectional left ventricular outflow tract velocities before and after aortic valve replacement: a comparative study with two-dimensional Doppler ultrasound. J Am Soc Echocardiogr 6:279–285 [DOI] [PubMed] [Google Scholar]
- 20.Petersen JW, Liu J, Chi YY, Lingis M, Williams RS, Rhoton-Vlasak A, Segal MS, Conrad KP (2017) Comparison of multiple non-invasive methods of measuring cardiac output during pregnancy reveals marked heterogeneity in the magnitude of cardiac output change between women. Physiol Rep 5:E13223. [DOI] [PMC free article] [PubMed] [Google Scholar]


