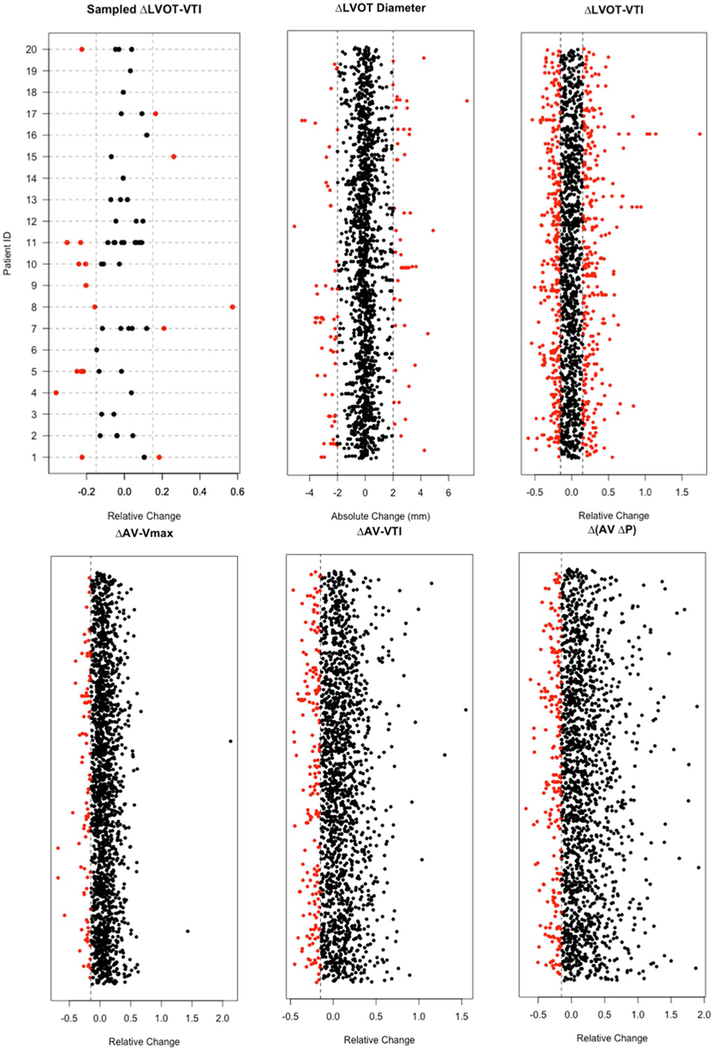
Fig. 2.
Distributions of measurement differences between consecutive examinations in individual patients. Except for LVOT diameter, which are absolute changes from the reference, all the changes of other measurements are relative changes from the reference. The dots on the same row indicate multiple measurements in the same patient. To better illustrate this, we randomly sampled 20 patients and show the distribution of their LVOT VTI measurement differences from the reference (on the same horizontal dashed line). Some rows only have one dot as a dot represents the difference in a pair of TTE studies. Red dots indicate erroneous measurements according to the preset cutoffs depicted by vertical dotted lines (see text for details)

