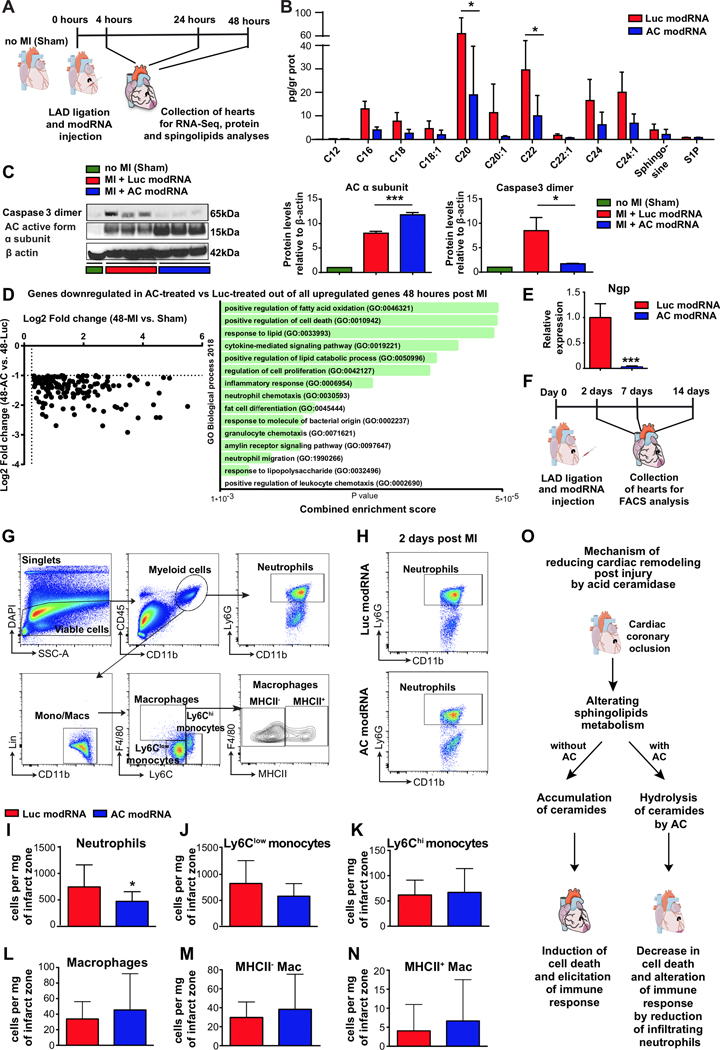
Figure 5. AC modRNA reduces ceramide levels and alters the immune cell composition in the left ventricle post MI.
A, modRNAs for Luc or AC were injected into mouse hearts immediately after MI. Lipids and proteins were extracted from the hearts 24 hours post MI to analyze sphingolipids by mass spectrometry and proteins by western blot. For RNA sequencing, hearts were harvested 4, 24 or 48 hours post MI. B, Sphingolipid levels after Luc or AC modRNA treatment, assessed 24 hours post MI, n=3. C, Western blot and quantification of AC α subunits and caspase 3 dimers in sham-operated hearts and in hearts treated with Luc or AC modRNA, 24 hours post MI, n=3. D, Scatterplot and GO enrichment analysis of all genes downregulated in AC-treated vs. Luc-treated out of all upregulated genes 2 days post MI, n=4. E, Relative Ngp gene expression levels 2 days post MI in the LV of mice treated with Luc or AC, quantified using qPCR, n=4. F, To analyze modRNA treatment’s effect on immune cell content after MI, hearts were collected at 2, 7 and 14 days post MI and Luc or AC modRNA injection and analyzed using flow cytometry. G, Gating strategy for immune cell populations in the infarct zone of modRNA-treated hearts. Neutrophils are defined as CD45+ CD11b+ Ly6G+, macrophages as CD45+ CD11b+ Lin- F4/80+ Ly6Clow/int and monocytes as CD45+ CD11b+ Lin- F4/80- Ly6Clow / Ly6Chi. H, Representative plots of neutrophil populations in Luc modRNA or AC modRNA-treated hearts 2 days post MI. I-N, Flow cytometric quantification of immune cell subsets in the infarct zone of Luc modRNA- and AC modRNA-treated hearts 2 days post MI included following populations: neutrophils, n=16 (I); Ly6Clow monocytes, n=16 (J); Ly6Chi monocytes, n=16 (K); total macrophages, n=16 (L), MHCII-, n=16 (M) and MHCII+, n=16 (N) macrophage subsets, n=16. O, Summary of proposed AC modRNA action mechanism during and after acute MI. ***, P<0.001, *, P<0.05, n=3 (B, C), n=4 (E), n=16–18 (I-N). Holm-Sidak correction for multiple comparisons (B), one-way ANOVA, Tukey’s Multiple Comparison Test (C) and two-tailed Student’s t-tests (E&I-N). Scale bar 20μm. The results include two and three (FACS) independent experiments.

