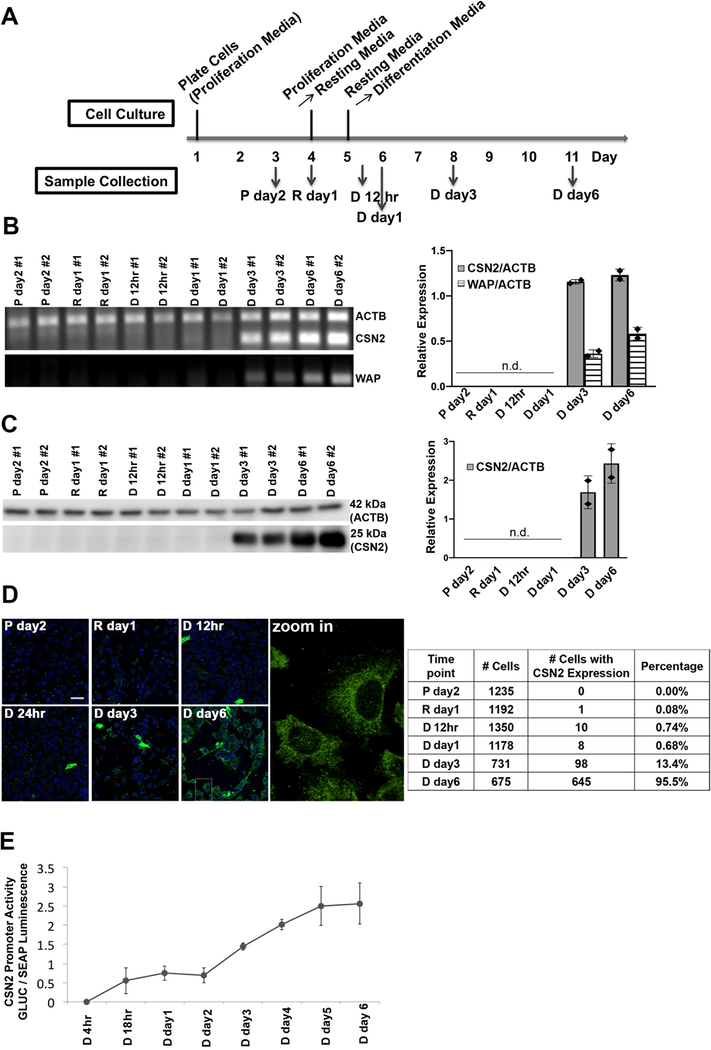
Figure 1: Characterization of HC11 cell differentiation upon hormone treatment.
(A) Outline of the differentiation protocol (P, proliferation media; R, resting media; D, differentiation media). (B) RT-PCR of control gene actin (ACTB) and differentiation markers casein (CSN2) and whey acid protein (WAP). Left: Agarose gel showing intensity of PCR signal over the course of differentiation; Right: mean values of relative expression of CSN2 and WAP normalized to ACTB. n.d., not detected. Each diamond represents a biological replicate. (C) Immunoblot of CSN2 and ACTB protein expression at different time points. Left: SDS-PAGE blot and Right: mean values of relative protein expression (CSN2 normalized to ACTB). n.d., not detected. Each diamond represents a biological replicate. (D) Immunofluorescence of casein protein expression at the single cell level. Left: representative fluorescence images. Green: CSN2; Blue: Nucleus. Scale bar, 40 μm. Right: Quantification of immunofluorescence. Percentages represent cells with CSN2 expression divided by the total cell number. Counts are from 2 independent experiments. (E) Dual luciferase reporter assay of the transcriptional activity of the CSN2 promoter at different time points post hormone treatment. The Gaussia Luciferase (GLUC) signal was normalized to the signal of the constitutively expressed secreted alkaline phosphatase (SEAP) (n = 2). Error bars represent standard deviation.

