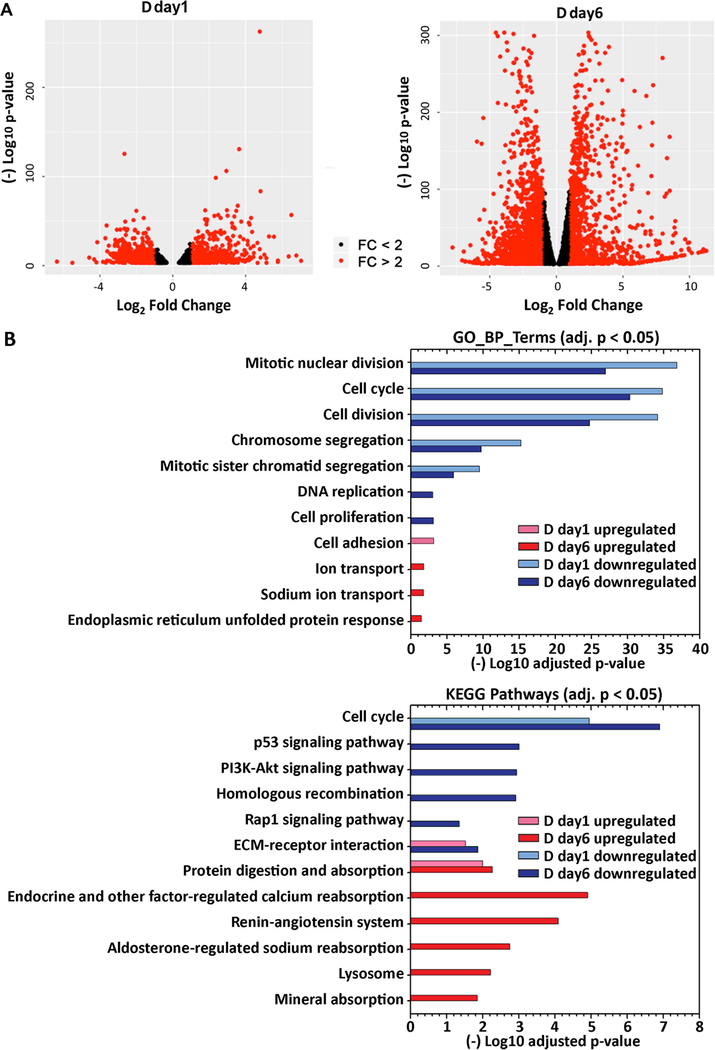
Figure 2. Global differential expression at day 1 and day 6 post hormone treatment.
(A) Differentially expressed genes identified from DEseq2 (padj < 0.001), as plotted in volcano plots. Genes upregulated or downregulated with fold change > 2 are labeled as red dots. (B) Functional annotation of upregulated and downregulated genes was performed using DAVID GOTERM_BP_DIRECT or KEGG pathway annotations. Select GO terms (adjusted p < 0.05) or KEGG pathways (adjusted p < 0.05) in either the D day1 or D day6 samples are visualized in the bar plot.

