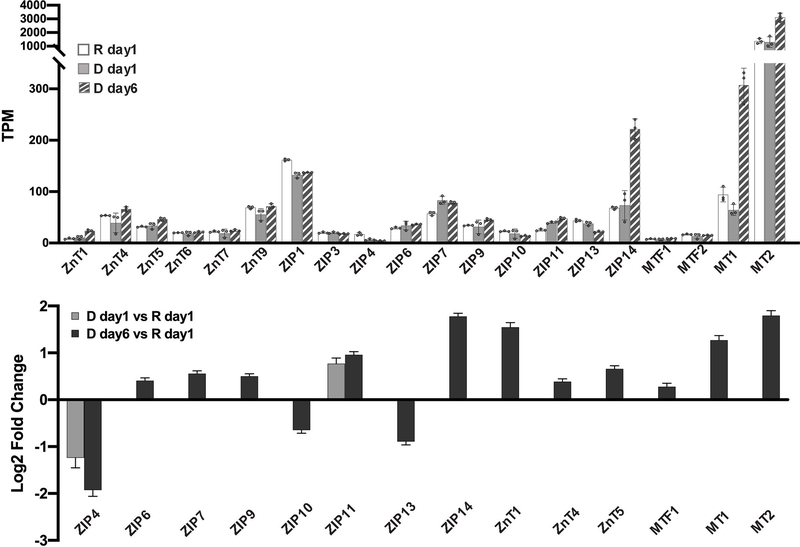
Figure 4. Differential expression of zinc homeostasis genes.
(A) Mean TPM values from 3 independent biological replicates for zinc homeostasis genes under resting and differentiated conditions. Each dot represents a biological replicate. Error bars represent standard deviation among 3 biological replicates. (B) Mean log2(Fold Change) of differentially expressed zinc homeostasis genes upon hormone treatment normalized to expression under resting conditions. Only genes with mean TPM > 1 are included. Differential expression was analyzed using DESeq2, padj < 0.001. Error bars represent lfcSE (log fold change Standard Error) among 3 biological replicates.

