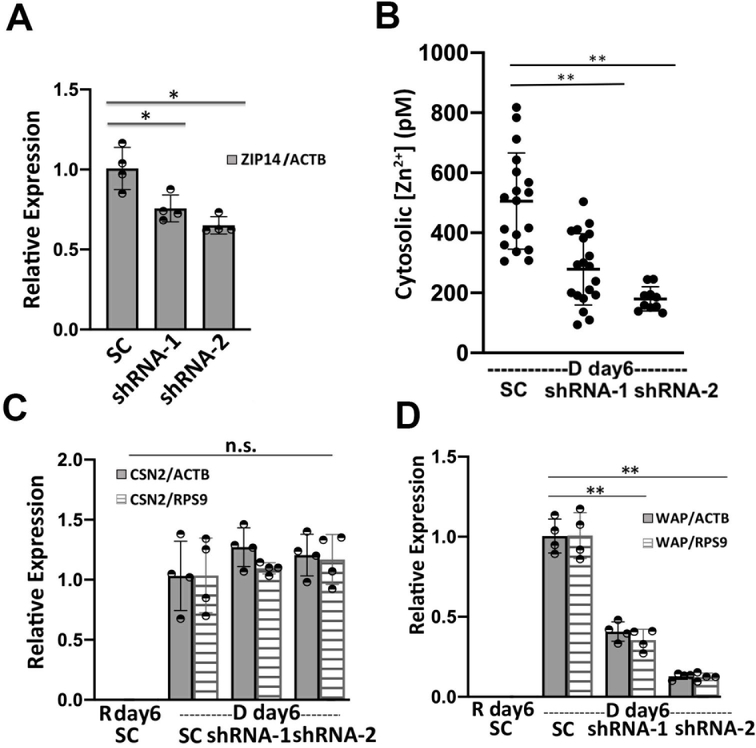
Figure 7. ZIP14 increases cytosolic Zn2+ at D day6 and activates WAP mRNA expression.
(A) The relative expression of ZIP14 normalized to ACTB in ZIP14 knockdown (KD) cells expressing two different shRNAs compared to scrambled control shRNA. (B) Cytosolic Zn2+ concentration in ZIP14 KD cells compared to control cells at 6 days post hormone treatment. Each dot represents a single cell and black line represents the mean value of each group. Error bar represents standard deviation. **, p< 0.0001, one-way ANOVA test with Post Hoc Tukey HSD (n > 9). (C-D) ZIP14 knockdown depressed the mRNA expression of WAP (D) but had no effect in the CSN2 mRNA level (C) in D day6 cells. Relative mRNA level in (A, C, D) was determined using RT-qPCR and mean values are represented by bar plots with each dot representing a biological replicate. *, P < 0.05; **, p < 0.001, unpaired student’s t-test (n=4).

