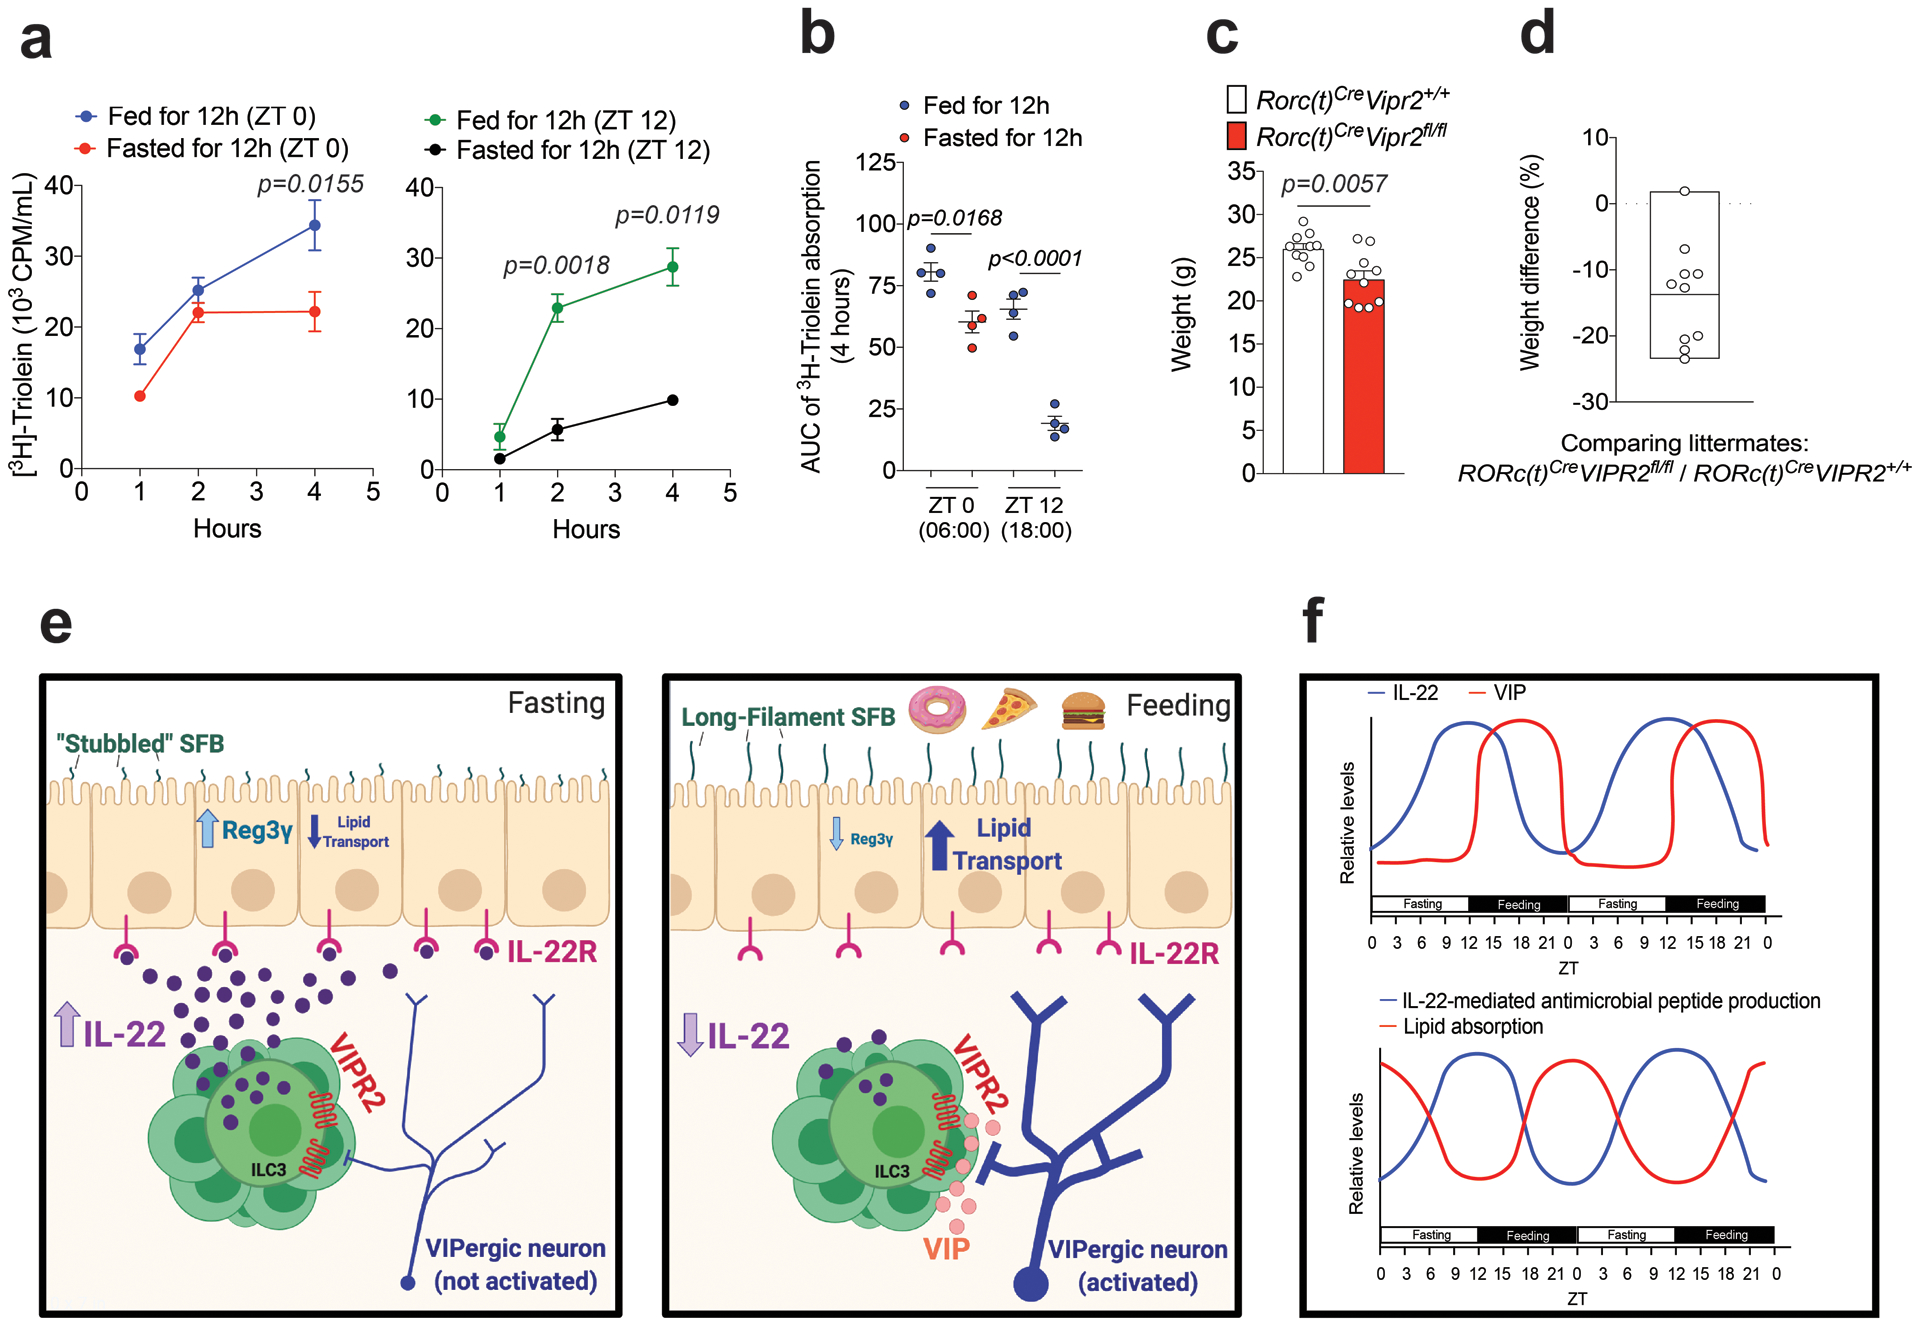
Extended Data Figure 10. Feeding increase the efficiency of triglyceride absorption.

a, b, Plasma 3H CPM (counts per minute) in mice fed or fasted for 12h during the light-phase (ZT 0 – ZT 12, red and green circles) or during the dark-phase (ZT 12 – ZT 0, blue and black circles) and then gavaged with 3H-triolein and sampled at different times (a); and AUC during 4h (b). AUC: Area under the curve per mL of plasma. n=4 mice per group, Mean ± SEM, two-way ANOVA (a) and one-way ANOVA (b). From 2 independent experiments. c, Weight of 10 littermate/cagemate pairs of RORc(t)Cre Vipr2+/+ and RORc(t)Cre Vipr2fl/fl mice under regular chow diet (male, 9 weeks old). Mean ± SEM, two-sided t-test. Representative of two independent experiments (males and females). d, Weight difference (%) between each RORc(t)Cre Vipr2fl/fl (n=10) compared to its paired RORc(t)Cre Vipr2+/+ littermate/cagemate (n=10) mice from Extended data Figure 10c. Mean (box limits represent the minimum and maximum values observed). e,f, Graphical abstract (e) and theoretical model (f) of the observations described created with BioRender.
