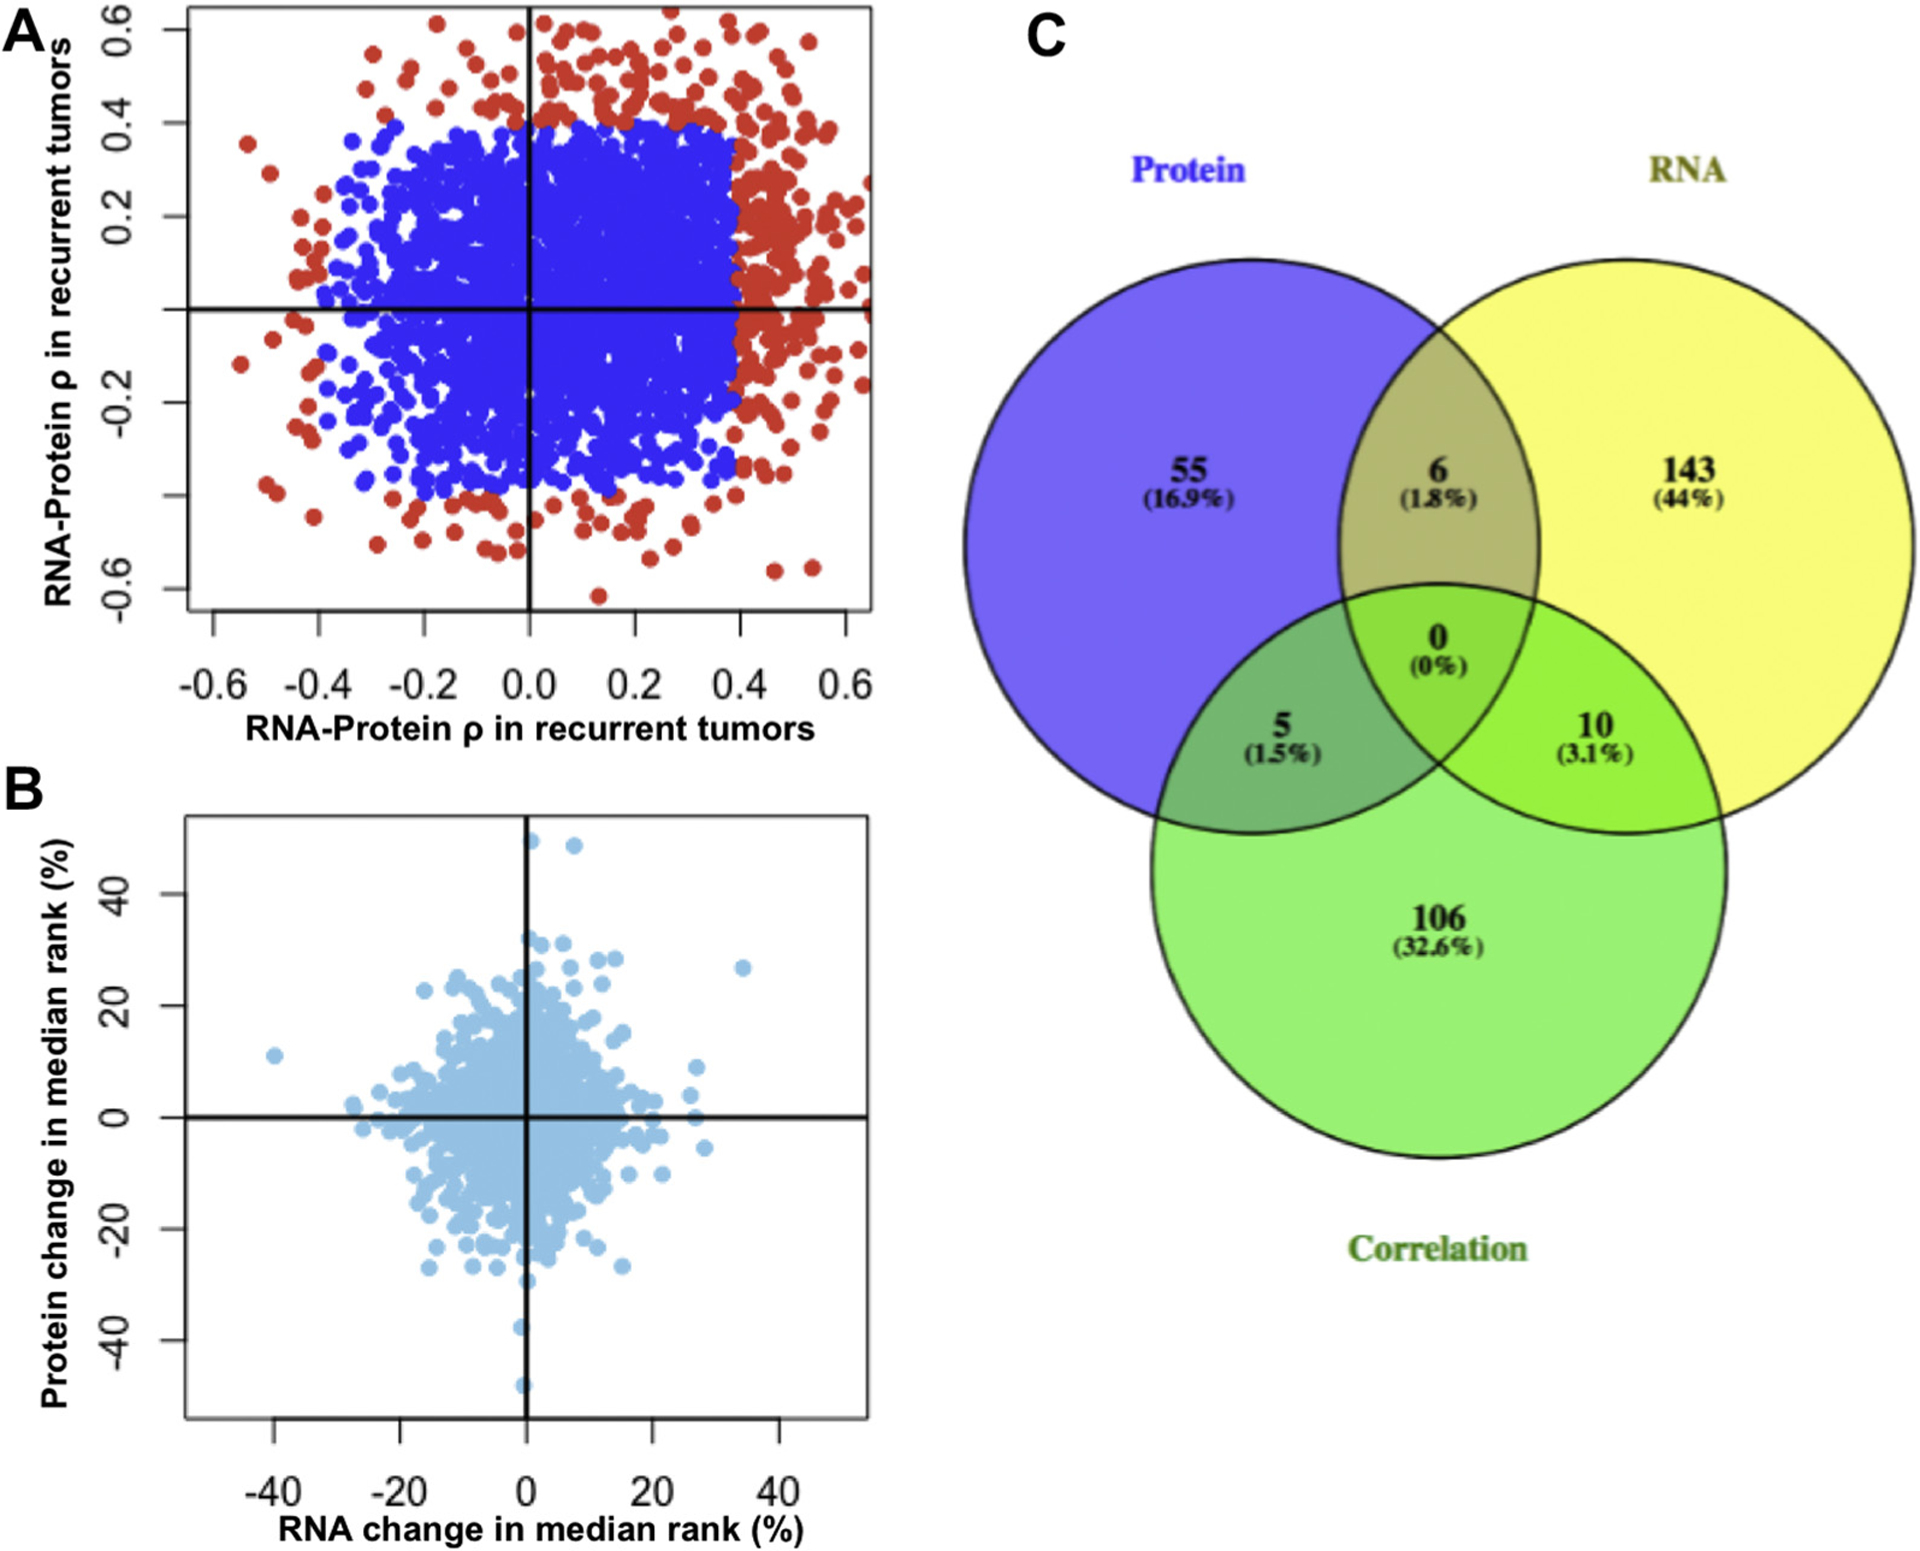
Figure 2.

Synergistic discovery of differentially regulated genes using matched RNA and protein abundances. (A) RNA-protein correlations within recurrent and nonrecurrent patient cohorts are shown in a scatterplot. Genes whose RNA-protein abundances are significantly correlated or anticorrelated (uncorrected p value < 0.05) are shown in red. (B) RNA and protein differential expression is shown as the change in median rank abundance between nonrecurrent and recurrent cohorts. Genes are differentially expressed at RNA and protein levels. (C) Overlap of genes differentially expressed at the protein and RNA levels, as well as genes that are differentially correlated. Zero genes displayed simultaneous differential expression at both levels and differential correlation. Please see Supplemental Methods for more information about how differential expression and correlation was computed.
