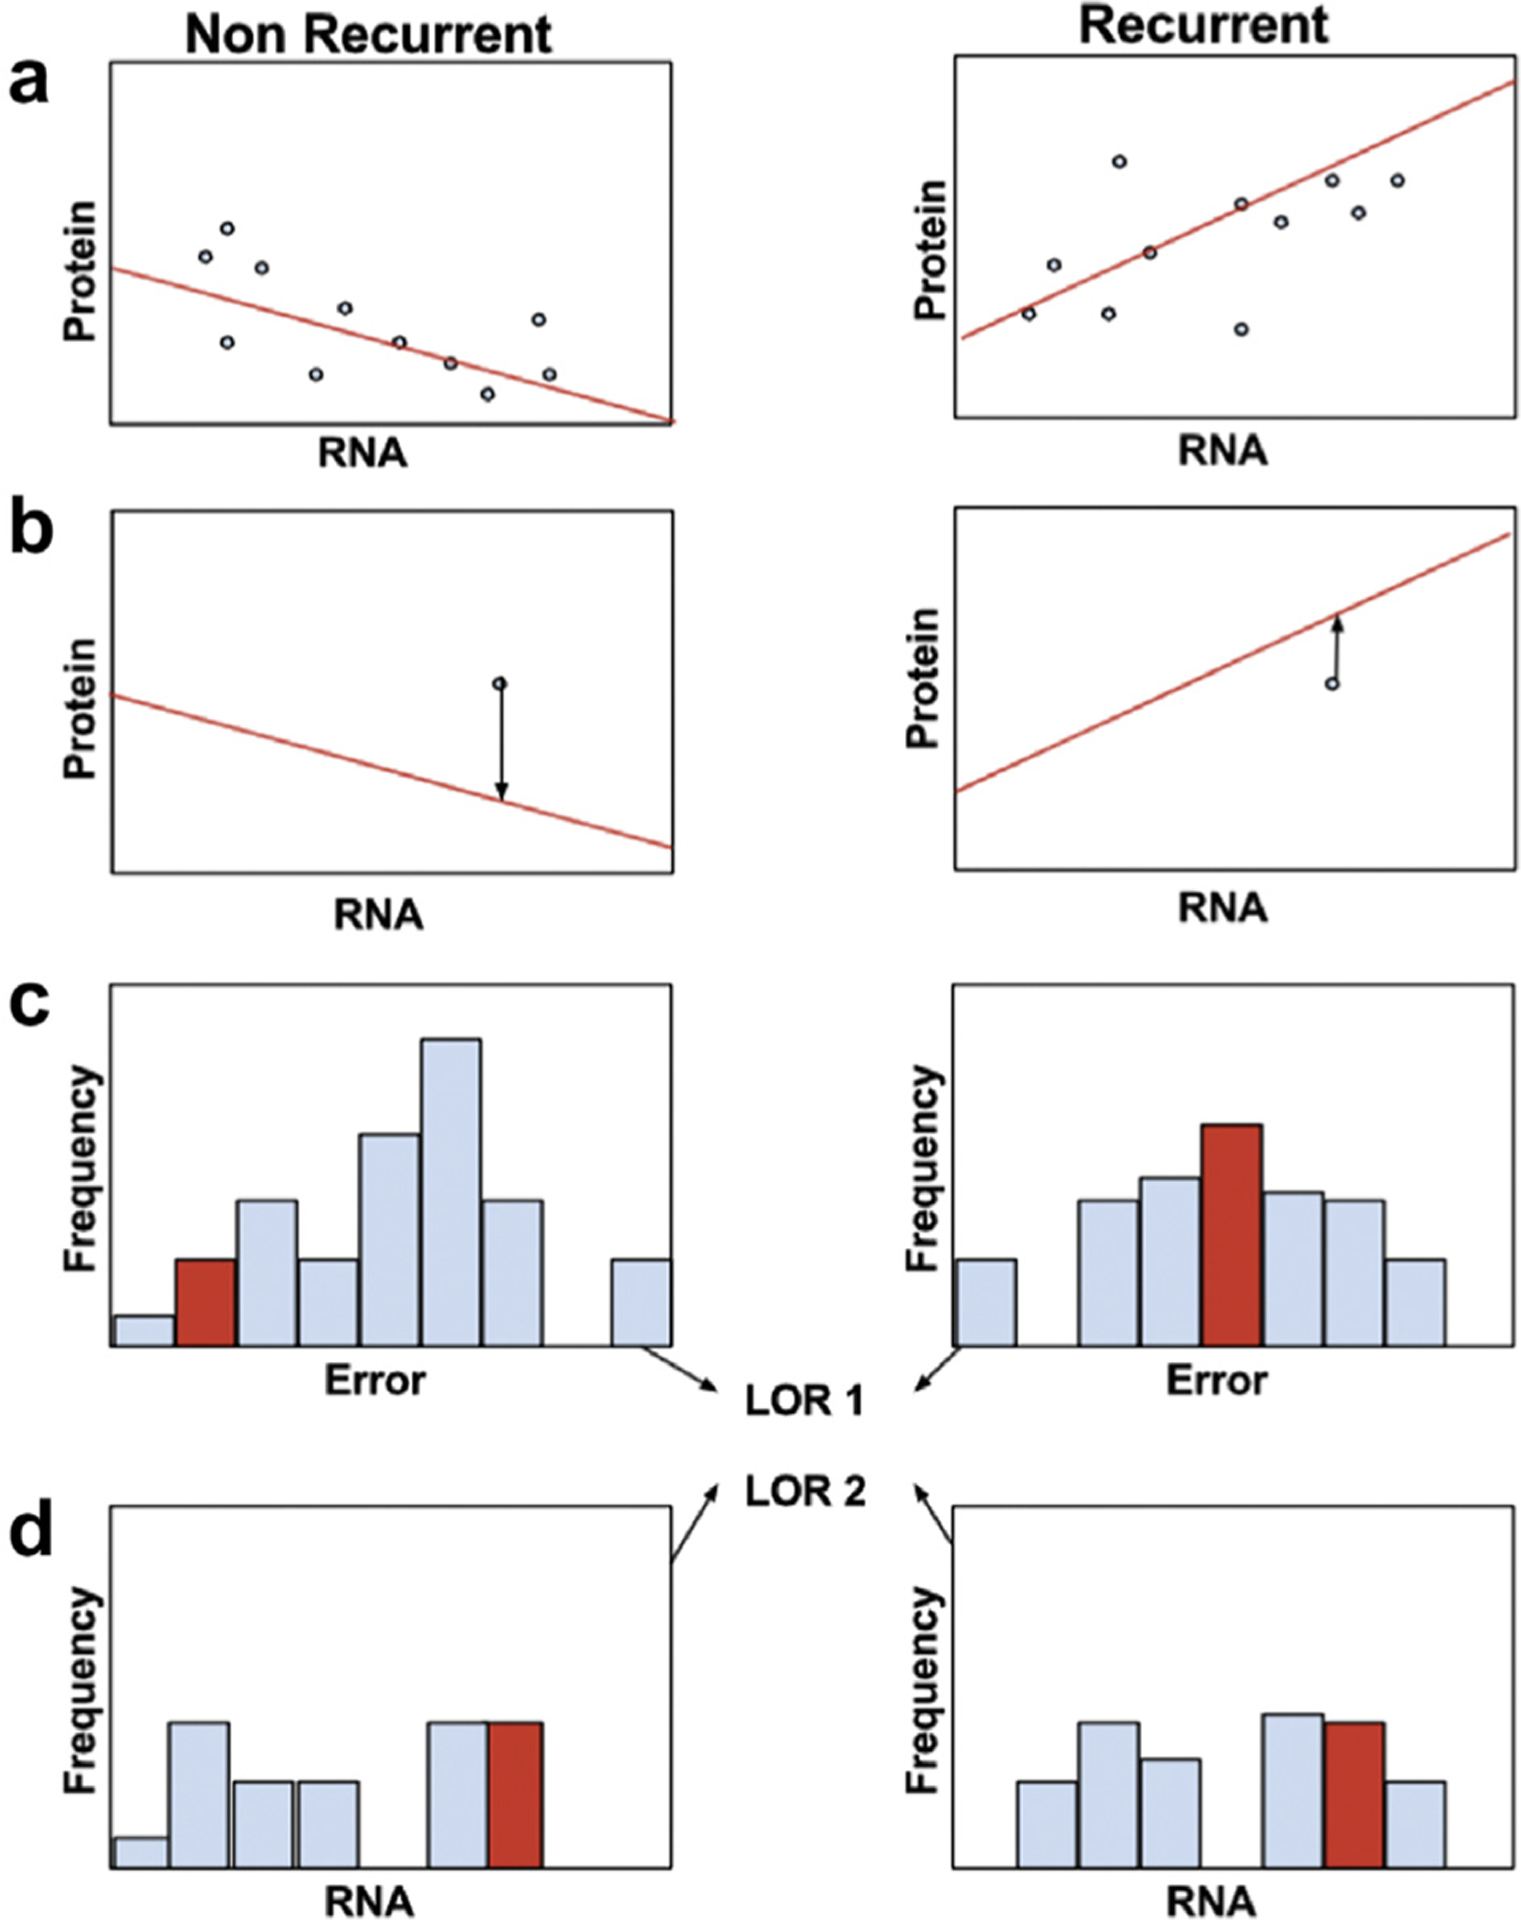
Figure 4.

Overview of integrative RNA-protein biomarker discovery pipeline. (A) Patients are divided into their clinical groups; here we use binary recurrence status to group the patients. Regression is then performed using trendfiltering to find a relationship between RNA and protein abundances within each cohort. (B) This model is then used to test a separate test sample or samples. Given a test RNA abundance, the test error is calculated as the difference between the predicted protein value and the test protein value (arrows). (C) The test errors are then compared to the distributions of training errors in each cohort, and a log odds ratio is calculated (LOR1). (D) Because this integrative method does not detect differential RNA abundances in the absence of differential protein abundances, a second log odds ratio is calculated by comparing the test RNA abundances to the training RNA abundances in each cohort (LOR2).
