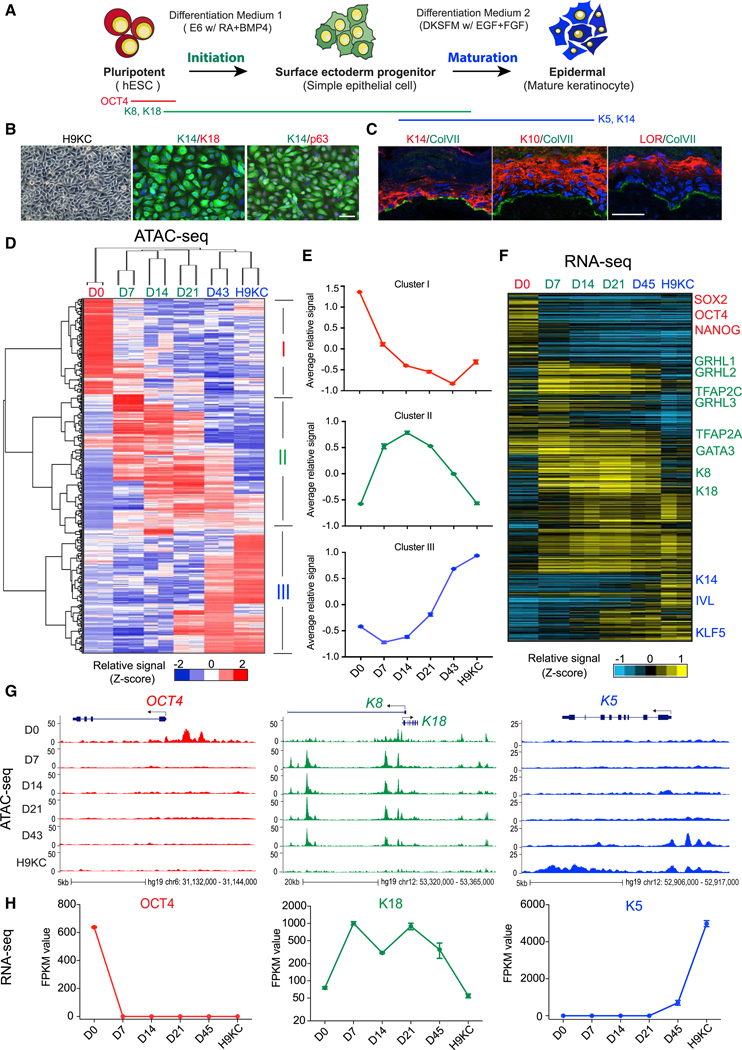
Figure 1. Accessible Chromatin and Transcriptome Landscapes Identify Three Major Chromatin Stages during Epidermal Lineage Commitment.
(A) Schematic overview of epidermal differentiation from human embryonic stem cells (hESCs).
(B) Light image and immunofluorescence (IF) staining of keratinocytes derived from H9 hESCs (H9KC). Scale bar, 50 mm. K14, keratin 14; K18, keratin 18.
(C)Reconstruction of stratified epidermis with H9KC in organotypic culture. IF staining shows the maker localization in the organotypic epidermis. The nuclei were stained with DAPI (blue). Scale bar, 25 mm. LOR, loricrin; ColVII, collagen VII.
(D)Heatmap of differential open chromatin regulatory elements (REs) characterized from ATAC-seq. Hierarchical clustering yields three clusters of elements and three major groups of samples. The color bar shows the relative ATAC-seq signal (Z score of normalized read counts) as indicated.
(E)The trend of signal changes of the three clusters identified from ATAC-seq in (D).
(F)Heatmap of expression changes of the genes containing differential ATAC-seq signals at their promoters. The color bar shows the relative expression value (Z score of FPKM [fragments per kilobase of transcript per million mapped reads]) from the RNA-seq.
(G) Normalized ATAC-seq profiles at OCT4, K8-K18, and K5 loci, representing the dynamic changes of the three clusters identified in (D) and (E), respectively.
(H) Gene expression changes of OCT4, K18, and K5.
See also Figures S1 and S2.

