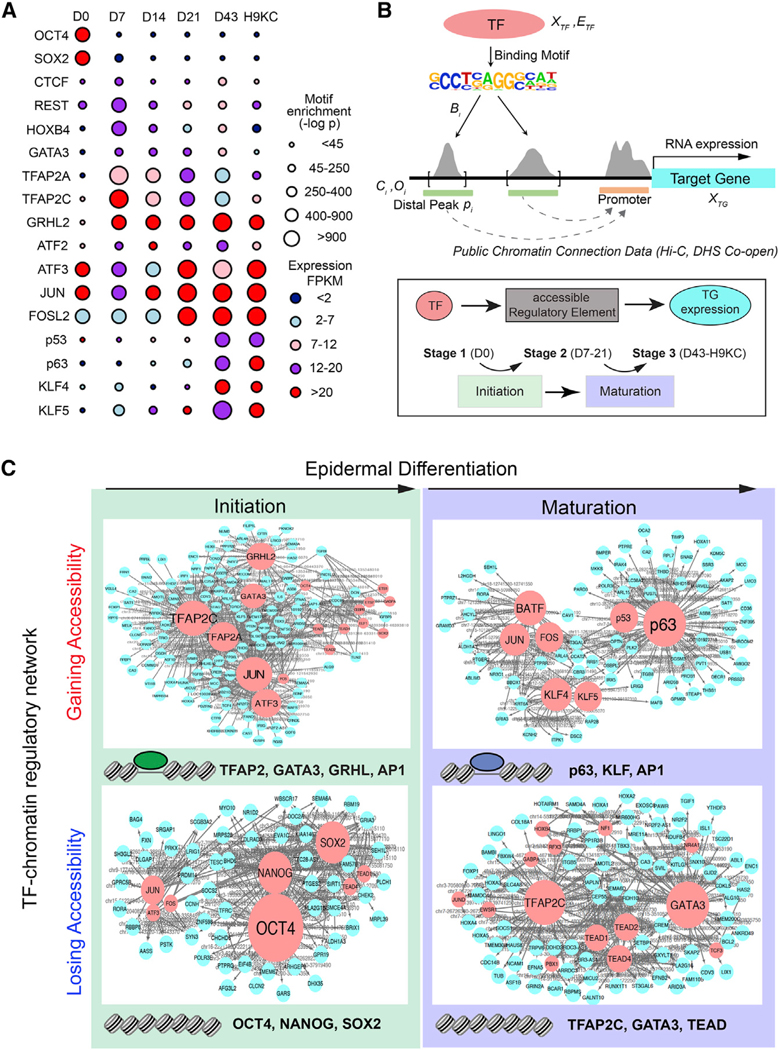
Figure 2. Identification of Master TFs Driving Surface Ectoderm Initiation and Keratinocyte Maturation by the TF-Chromatin Transcriptional Regulatory Network.
(A)TF motifs identified from differential ATAC-seq peaks at each time point. The circle size represents different levels of motif enrichment, and the color represents the expression level of each TF in RNA-seq data.
(B)Schematic overview of the method for constructing TF-chromatin transcriptional regulatory network. (Top panel) Connections between TF and target gene (TG) are established through motifs present in open chromatin and publicly available chromatin conformation data. (Bottom panel) The triple elements, i.e., TF-accessible RE (i.e., ATAC-seq peaks)-TG expression, were ranked by the coherence among genomic features and extracted through a statistical model to build the regulatory network. We investigated and ranked their feature changes (Figures S3A–S3C) during two major transition events, initiation and maturation.
(C)TF networks identified from the chromatin regions gaining or losing accessibility in the initiation and maturation process. The red and blue nodes represent TF and TG, respectively; the gray edges represent the accessible RE, which was bound by TF to regulate TG expression. Larger size of TF nodes represents more TG connections. Top-ranked TFs are listed at the bottom of each network. Note: TF family name was used to represent several members.
See also Figure S3.

