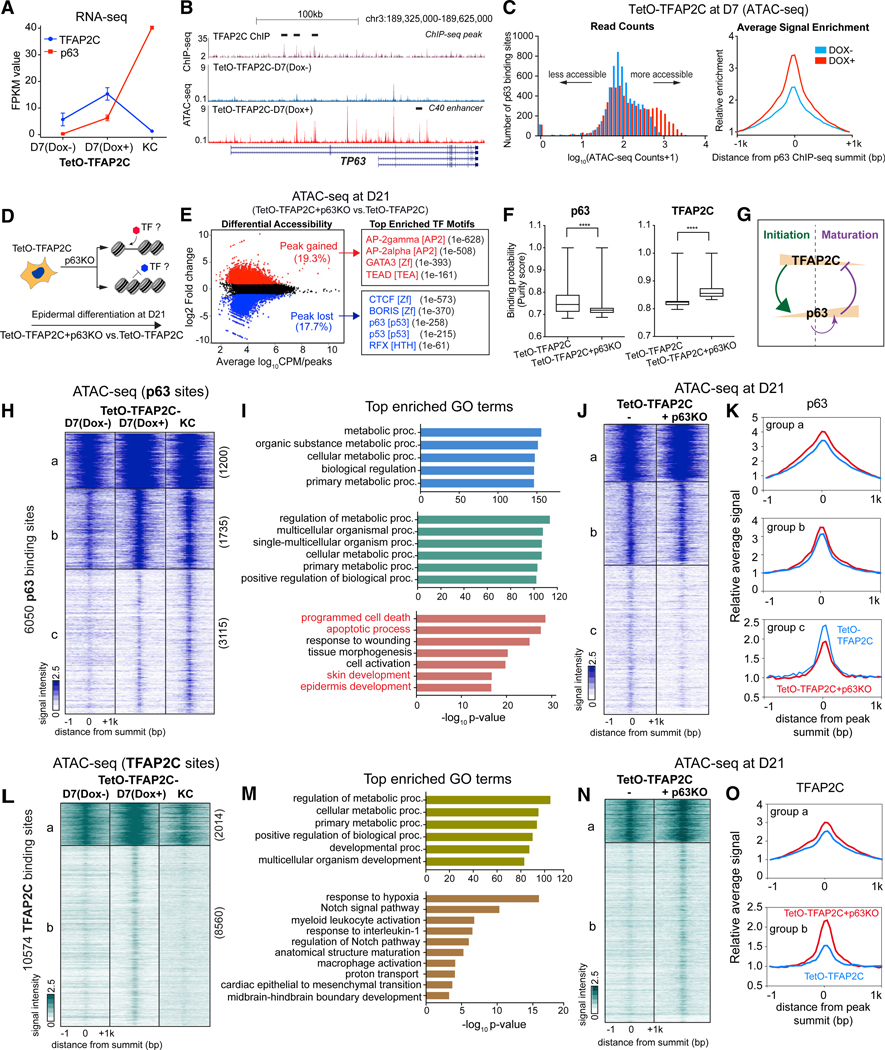
Figure 6. Feedback Regulation between p63 and TFAP2C Drives Chromatin Transition from Progenitor to Mature Keratinocytes.
(A) Gene expression changes of TFAP2C and p63 during TFAP2C-induced epidermal differentiation.
(B) Genome browser tracks show ATAC-seq signal in TetO-TFAP2C cells ± Dox induction, relative to TFAP2C ChIP-seq (black bar highlights the peak region) fromD7 Dox-induced differentiation at TP63 locus. Note: two isoform types (full-length and deltaN-p63) are schematically shown. There are multiple regions gaining accessibility signal at TP63 locus upon Dox induction, including the p63 self-activation enhancer: C40 enhancer (black bar annotated).
(C) p63 binding sites become more accessible in TFAP2C-induced surface ectoderm progenitor cells. Histograms of read counts distribution (left) and average signal enrichment (right) of ATAC-seq in p63-bound regions in cells with and without TFAP2C induction are shown.
(D) Schematic illustration of identification of TF motifs associated with chromatin accessibility changes upon p63 loss of function.
(E) (Left) Scatterplot of differential accessibility in TetO-TFAP2C+p63KO versus TetO-TFAP2C at D21. (Right) Top enriched TF motifs identified from differential accessible regions are shown. TF motif name, TF family, and p values are presented.
(F) PIQ footprinting analysis indicates a lower likelihood of TF occupancy of p63 and a higher likelihood of TFAP2C in p63 KO cells (TetO-TFAP2C+p63KO). Significant difference with ****p < 0.0001 relative to control (TetO-TFAP2C) was determined by t test.
(G) A model diagram shows TFAP2C/p63 negative feedback regulation and p63 self-activation during epidermal lineage commitment.
(H) Heatmap shows chromatin accessibility changes within p63-bound regions during TFAP2C-induced epidermal differentiation. K-means clustering identifies three groups of changes (labeled as “a, b, and c” with respective numbers).
(I) Top enriched GO terms identified from the three clusters shown in (H).
(J and K) Comparison of ATAC-seq signal between TetO-TFAP2C+p63KO versus TetO-TFAP2C in the three groups of p63 binding sites. The heatmap (J) and average enrichment (K) of signal are shown.
(L) Heatmap shows chromatin accessibility changes within TFAP2C-bound regions during TFAP2C-induced epidermal differentiation. K-means clustering identifies two groups of chromatin changes (labeled as a and b with respective numbers).
(M) Top enriched GO terms identified from the two clusters in (L).
(N) Comparison of ATAC-seq signal changes between TetO-TFAP2+p63KO versus TetO-TFAP2C in the two groups of TFAP2C binding sites. The heatmap (N) and average enrichment (O) of signal are shown.
See also Figure S7

