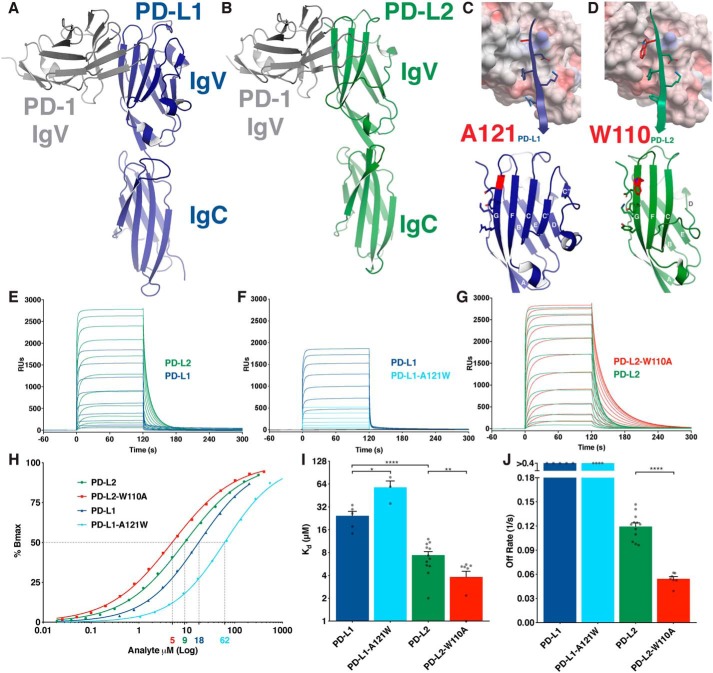
Figure 1.
W110 of PD-L2 acts as an elbow to hinder PD-1 binding. A and B, ribbon diagrams of the murine PD-1 IgV domain (gray) in complex with the IgV and IgC domains of human PD-L1 (blue) (PDB code 3BIK) (A) and hPD-L2 (green) (hPD-L2 sequence threaded onto PDB code 3BP5) (B). C and D, upper panels show surface electrostatic representation of mPD-1 with the G-strands of PD-L1 (blue) (C) or PD-L2 (green) (D) in ribbon and stick representation. Lower panels show front faces of IgV domains of PD-L1 (blue) (C) and PD-L2 (green) (D) with β-strand lettering and A121PD-L1 and W110PD-L2 highlighted in red. E–G, SPR sensorgrams of the indicated PD-ligand analytes injected over immobilized PD-1. H, representative, normalized binding curves. I, affinity measurements from independent experiments. J, dissociation rates from independent experiments. Dissociation rates exceeding the range of accurate measurement are shown as >0.4 s−1. Unpaired t tests: *, p < 0.05; **, p < 0.01; ****, p < 0.0001; RU, response units.

