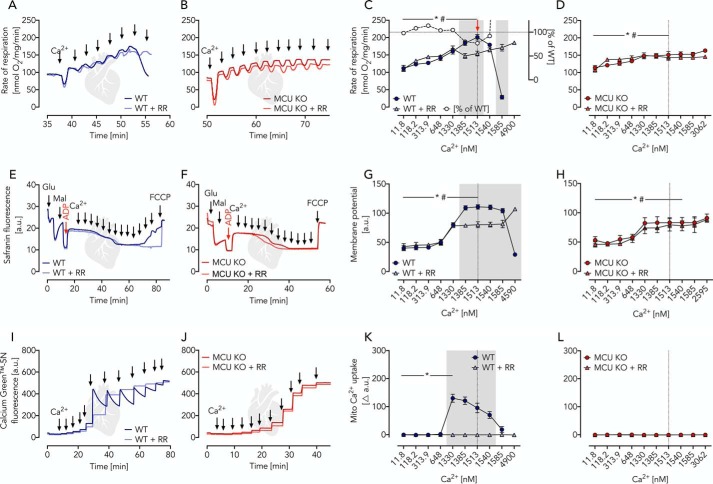
Figure 4.
Ca2+-dependent glutamate/malate-driven OXPHOS in heart mitochondria isolated from WT and MCU KO mice characterized by parallel measurements of respiratory rates, membrane potential, and Ca2+ uptake under similar conditions. A and B, respiratory traces of WT and MCU KO heart mitochondria in EGTA media supplemented with glutamate, malate, ADP, and RR as indicated; arrows specify Ca2+ additions for a stepwise increase from ∼12 nm to 2 μm. C, respiratory rates of WT heart mitochondria in the presence and absence of RR as indicated shown as mean ± S.E. (error bars) of n = 5 experiments plotted against free Ca2+ concentrations. The red arrow indicates significantly increased Ca2+-induced respiration in WT (*, p < 0.05) and WT + RR (#, p < 0.05) mitochondria determined using two-way ANOVA with Dunnett's multiple-comparison post hoc test. Gray area, significant difference between WT and WT + RR mitochondria determined using two-way ANOVA with Sidak's multiple-comparison post-hoc test and a p value of <0.05. White circles visualize the percentage of WT + RR respiration compared with WT calculated from the mean values. D, respiratory rates of MCU KO heart mitochondria in the presence and absence of RR as indicated shown as mean ± S.E. of n = 5 experiments plotted against free Ca2+ concentrations. Statistical analyses were done as described for C. *, p < 0.05 in MCU KO; #, p < 0.05 in MCU KO + RR. E and F, mitochondrial membrane potential traces of WT and MCU KO heart mitochondria using safranin O as probe supplemented with glutamate, malate, ADP, and RR as indicated; a.u., arbitrary units; fluorescence after FCCP uncoupling served as zero value; arrows indicate Ca2+ additions of 100 μm each for a stepwise increase from ∼12 nm to 5 μm. G and H, mitochondrial membrane potential shown as mean ± S.E. of n = 5 experiments plotted against free Ca2+ concentrations. Statistical analyses were done as described for C and D. I and J, Ca2+ uptake traces in WT and MCU KO heart mitochondria using Calcium GreenTM-5N as probe supplemented with glutamate, malate, ADP, and RR; arrows indicate Ca2+ additions for a stepwise increase from ∼12 nm to 2 μm. K and L, changes in Ca2+ uptake shown as mean ± S.E. of n = 5 experiments plotted against free Ca2+ concentration. Statistical analyses were done as described for C and D.

