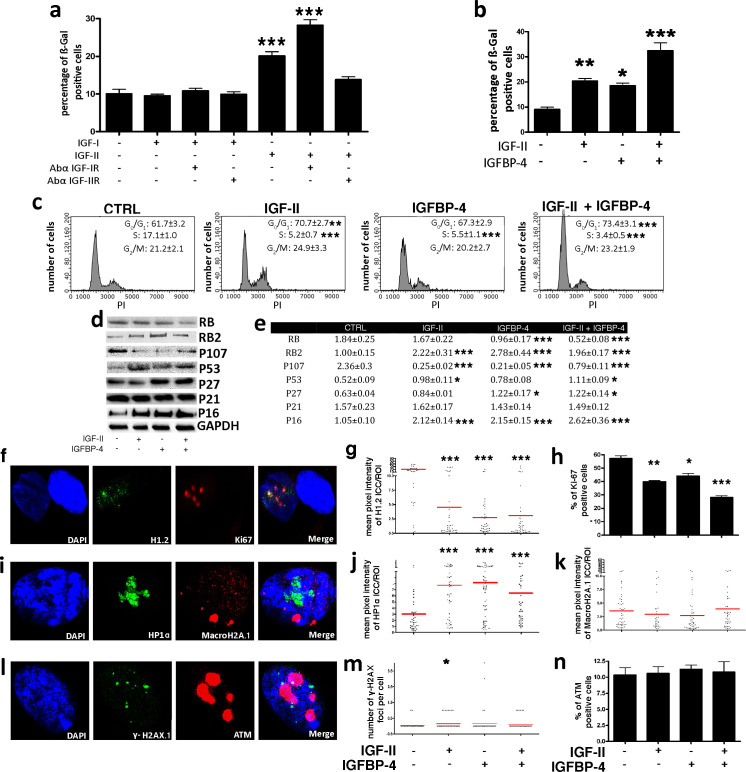
Figure 5. IGF-II and IGFP4 effects on senescence.
Panel a - The histogram shows the mean percentage value of the senescent cells 48 hr following the addition of 25 ng/ml IGF-I or IGF-II to the culture medium, in the presence or absence of 2 μg/ml anti-IGF-IR or anti-IGF-IIR. The data are expressed ± SD, n = 3. We compared the untreated cells (first column) with all the other experimental conditions and statistical differences are indicated with ***p<0.001. Panel b – The graph depicts the cell senescent level in the MSC cultures 48 hr after the media supplementation with 25 ng/ml IGF-II and/or 35 ng/ml IGFBP-4. The data are expressed as ± SD, n = 3. We compared the untreated cells (first column) with all the other experimental conditions and statistical differences are indicated with *p<0.05 or ***p<0.001. Panel c - The picture shows representative FACS analysis of the MSCs grown in the presence of IGF-II and/or IGFBP-4. The experiments were conducted in triplicate for each condition. The percentages of different cell populations (G1, S, and G2/M) are indicated. The data are expressed with standard deviation (n = 3). We compared the untreated cells (CTRL) with all the other experimental conditions and the statistical differences are indicated with *p<0.05 or **p<0.01 or ***p<0.001. Panel d – Western blot analysis of senescence-related proteins in MSC treated with IGF-II and/or IGFBP-4. GAPDH expression was used as the loading control. Panel e - The graph shows the densitometric analysis of the proteins depicted in panel d. We compared the untreated cells (CTRL) with all of the other experimental conditions, and the statistical differences are indicated with *p<0.05 or **p<0.01 or ***p<0. The data are expressed in arbitrary units. Panel f - Representative microscopic field of H1.2 (green) and Ki-67 (red) in MSC cultures. The nuclei were counterstained with DAPI (blue). Panel g – The graph displays the pixel intensity of anti-H1.2 immunostaining per ROI (region of interest). Each dot corresponds to the intensity detected in a single cell. The red bar represents the mean intensity value in the different experimental conditions. We compared the untreated cells (IGF-II-/IGFBP-4-) with all the other experimental conditions and the statistical difference are indicated with **p<0.01 or ***p<0.001. The data are expressed in arbitrary units. Panel h - The histogram shows the percentage of Ki-67(+) cycling cells in the MSC cultures in different experimental conditions. We compared the untreated cells (IGF-II-/IGFBP-4-) with all of the other experimental conditions, and the statistical differences are indicated with *p<0.05 or ***p<0.001. Panel i - Representative microscopic field of HP1 (green) and MacroH2A (red) in the MSC cultures. The nuclei were counterstained with DAPI (blue). Panel j – The graph displays the pixel intensity of anti-HP1 immunostaining per ROI (region of interest). Each dot corresponds to the intensity detected in a single cell. The red bar represents the mean intensity value. We compared the untreated cells (IGF-II-/IGFBP-4-) with all of the other experimental conditions, and the statistical differences are indicated with **p<0.01. The data are expressed in arbitrary units. Panel k – The graph displays the pixel intensity of anti-Macro H2A immunostaining per ROI (region of interest). Each dot corresponds to the intensity detected in a single cell. The red bar represents the mean intensity value. The data are expressed in arbitrary units. Panel l - Representative microscopic field of γH2AX (green) and ATM (red) in the MSC cultures. The nuclei were counterstained with DAPI (blue). Panel m - The graph shows the degree of H2AX phosphorylation (γH2AX). This was evaluated by counting the number of γH2AX immunofluorescent foci per cell. The foci number was determined for 200 cells. Each dot represents an individual cell. The red bars indicate the mean value for each category (n = 3). Panel n - The histogram shows the percentage of ATM(+) cells in the MSC cultures in different experimental conditions. The data are expressed with standard deviation, n = 3.

