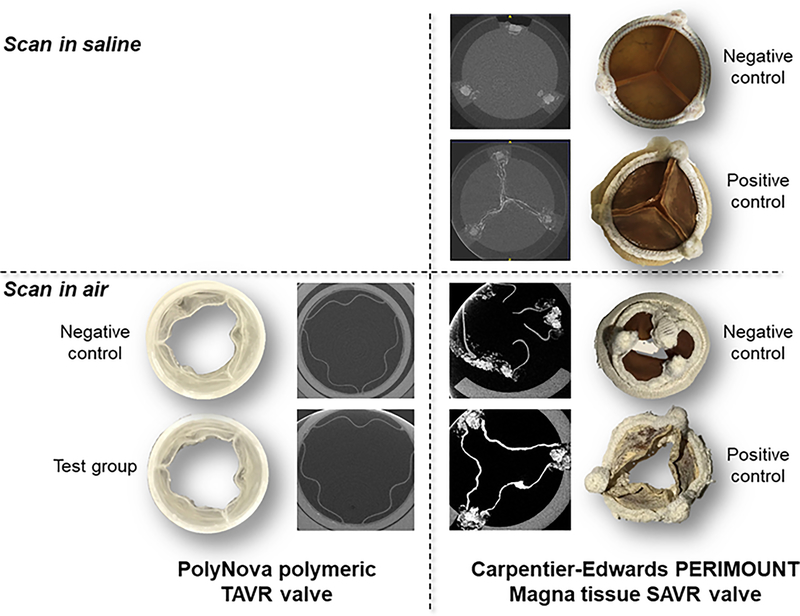
Figure 5.
The polymeric valves and tissue valves after 50M cycles in the pro-calcific compound. Top – saline wetted samples and matching μCT scans; Bottom – dried samples and matching μCT scans. The mineralization is clearer in the dried samples and spread all over the surface of the tissue leaflets, as well as in the bulk of the leaflet by the μCT. No evidence was seen in the polymeric valves.

