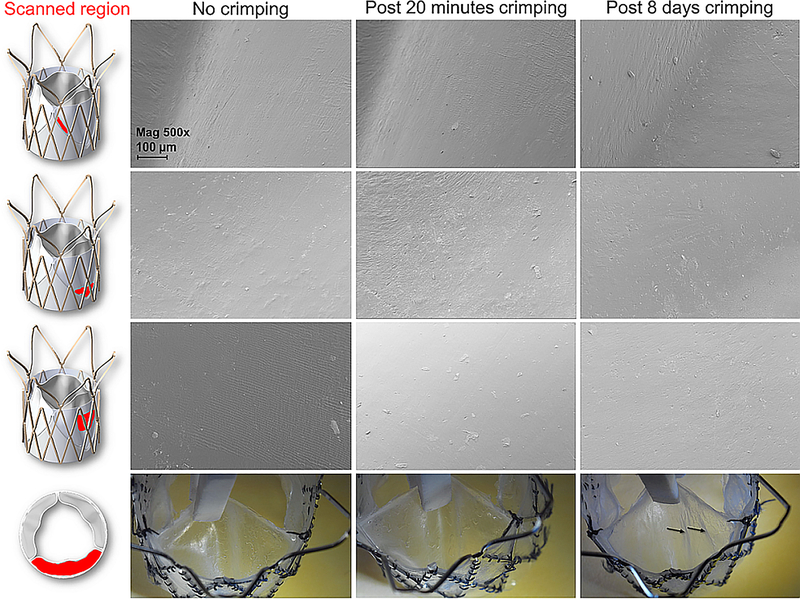
Figure 7.
Top - SEM images of the polymeric valves leaflets before crimping, and after 20 minutes or 8 days of crimping to 16 Fr. On the left side, the scanned region of the leaflet is marked in red. Bottom – pictures the polymeric leaflets from the aortic side of the valve. The black arrows mark light folding marks that were evident in the leaflets after 8 days of crimping for 16 Fr. These marks were not visible in SEM in the micro-scale. SEM magnification is 500x, scale bar denotes 100 μm.

