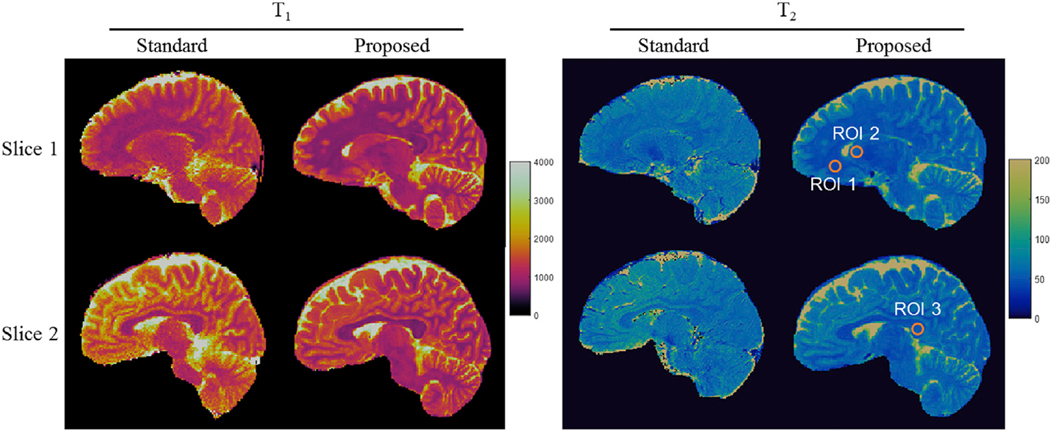
Fig. 11.
Comparison of T1 and T2 maps obtained using the proposed 3D MRF and the standard relaxometry methods from the same subject. The results acquired at two different slices are presented. Three ROIs were drawn manually to extract quantitative T1 and T2 values from multiple brain tissues and the results are shown in Table 2.

