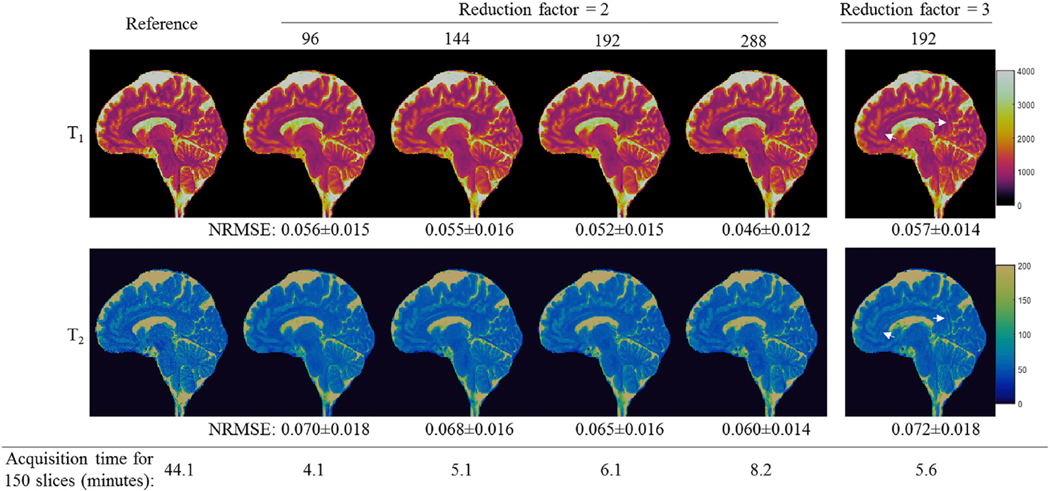
Fig. 6.
Representative T1 and T2 maps obtained using the 3DMRF-S method and different MRF time frames ranging from 96 (12.5%) to 288 (37.5%). High-quality tissue quantitative maps with 1-mm isotropic resolution were obtained for all the cases. The corresponding acquisition time for each sampling pattern is also presented. One case with a reduction factor of 3 is shown (right-most column), and some residual artifacts were noticed with this case with a higher reduction factor. NRMSE values were calculate from all the slices acquired for this subject. The mean and standard deviation values are presented in the figure.

