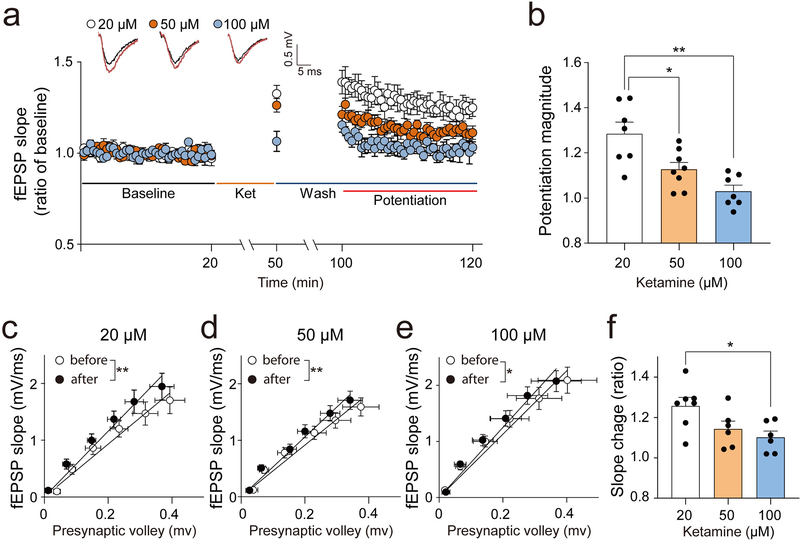
Fig. 3: Dose-dependent effects of ketamine-induced synaptic potentiation.
To examine the dose-response relationship in ketamine-driven postsynaptic potentiation, fEPSPs were recorded from the CA1 Schaffer-collateral pathway with three different concentrations of ketamine (20, 50 or 100 μM). After 20 min of stable baseline measurement, ketamine was applied for 30 min, then washed out for 50 min, followed by recordings of fEPSP responses for 20 min. (a, b) The highest potentiation magnitude was observed at 20 μM and significantly decreased at 50 and 100 μM (one-way ANOVA test, F(2, 17) = 9.721, p = 0.0015, n = 6 ~ 7 per group). (c-e) To confirm the change of basal neurotransmission by different concentrations of ketamine, the I-O curve relationship was measured before and after ketamine treatment. Ketamine significantly increased the slope of the IO-curve at all tested concentrations (paired t-test, 20 μM: t(6) = 5.359, p = 0.0017, 50 μM: t(5) = 4.505, p = 0.0064, 100 μM: t(5) = 3.049, p = 0.0285, n = 6 ~ 7 per group). (f) To confirm the dose-response relationship in the slope-change of the I-O curve, the ratio of the slope-change was analyzed. The biggest slope change was shown at 20 μM of ketamine. The ratio of slope change at 100 μM was significantly lower than at 20 μM of ketamine (one-way ANOVA test, F(2, 19) = 4.579, p = 0.0268, n = 6 ~ 7 per group). Graphs represent mean ± S.E.M., *, p < 0.05, **, p < 0.01

