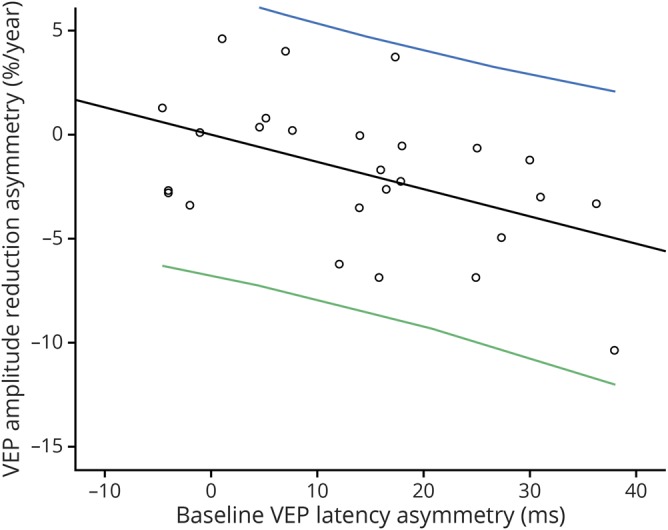
Figure 4. Correlation between baseline latency delay and asymmetry of the rate of mfVEP amplitude reduction (r = −0.47, p = 0.02).

The correlation remained significant after adjusted for age, sex, and disease duration (r = −0.50, p = 0.02). VEP = visual evoked potential.
