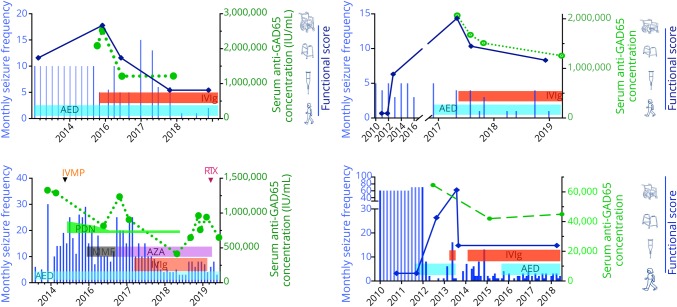
Figure 4. Disease course and treatment response of 4 patients in the high-concentration group.
Horizontal bars containing treatment abbreviations represent the time periods of the corresponding treatments. Blue vertical lines represent seizure frequency over time. Green discontinuous line connected by green circles shows evolution of serum anti-GAD65 concentration. Thick dark-blue line connected by rhomboids represents functional status over time, according to the visual score at the right most part of the charts. AED = antiepileptic drug; AZA = azathioprine; GAD = glutamic acid decarboxylase; IVIg = IV immunoglobulin; IVMP = IV methylprednisolone; MMF = mycophenolate mofetil; PDN = prednisone; RTX rituximab.

