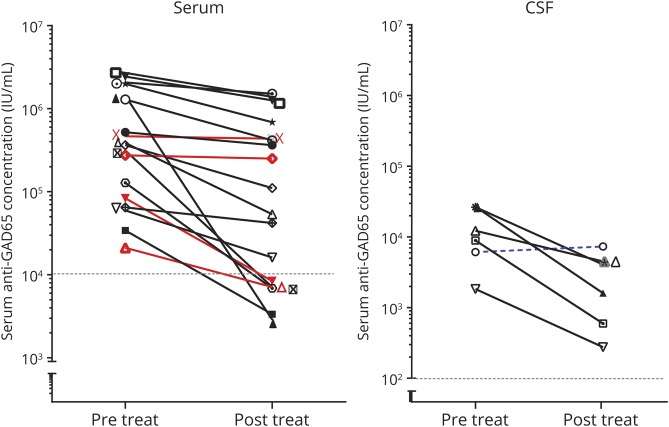
Figure 5. Antibody concentration response to immunotherapy.
Concentration responses to treatment of the 17 patients of whom pretreatment and posttreatment samples were available. Red lines represent the patients lacking clinical improvement. The blue dashed line in the right graph represent CSF samples obtained pretreatment and at clinical relapse. A reduction of at least 25% following immunotherapy was considered a relevant concentration reduction. GAD = glutamic acid decarboxylase.

