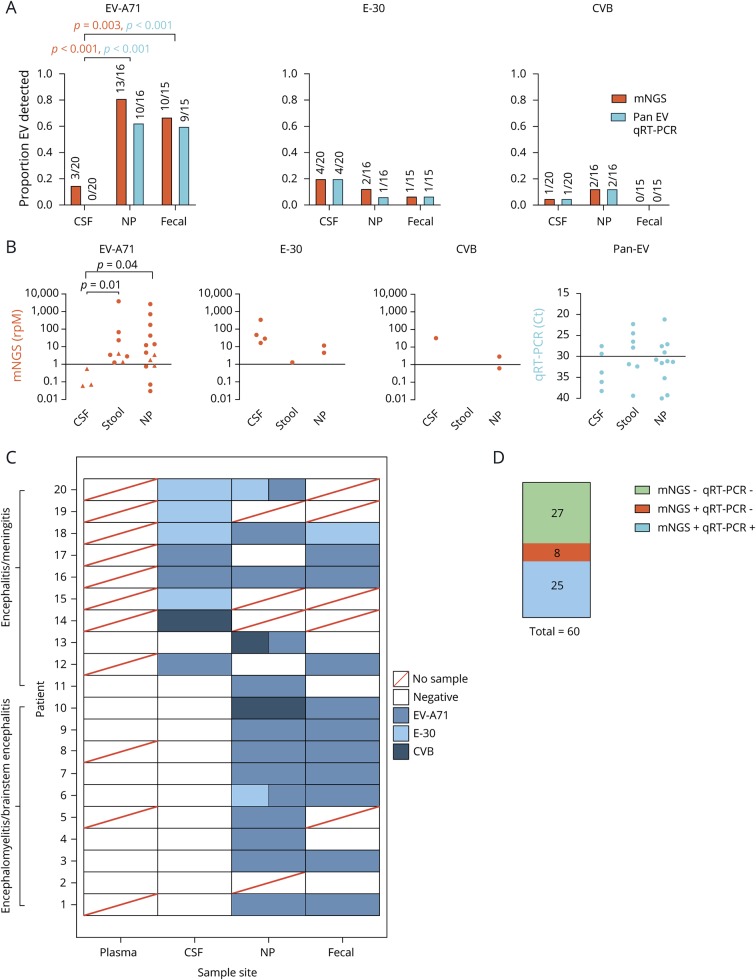
Figure 1. Summary of mNGS diagnostics: improvement over traditional clinical testing.
(A) Comparison of mNGS and qRT-PCR detection of EV-A71, E-30 and CVB in CSF, NP, and fecal samples. Statistics performed using the Fisher exact test, with orange and blue p-values corresponding with mNGS and qRT-PCR results, respectively. (B) Comparison of detection levels for each different experiment, with rpM representing mNGS and Ct values for qRT-PCR. Triangles denote samples identified by mNGS but not qRT-PCR. Statistics performed using a Mann-Whitney test. (C) Heatmap of each individual subject with each body site represented. Boxes with 2 colors represent codetections of different viral species. (D) Comparison of mNGS detection rates to qRT-PCR. Statistics performed using the McNemar test. CVB = Coxsackievirus B; E-30 = echovirus 30; EV-A71 = enterovirus A71; mNGS = metagenomic next-generation sequencing; NP = nasopharyngeal; qRT-PCR = quantitative reverse transcription polymerase chain reaction.

